
Search for Indicators
All Data
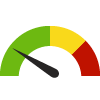
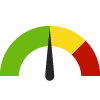
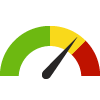
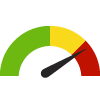
Indicator Gauge Icon Legend
Legend Colors
Red is bad, green is good, blue is not statistically different/neutral.
Compared to Distribution
 the value is in the best half of communities.
 the value is in the 2nd worst quarter of communities.
 the value is in the worst quarter of communities.
Compared to Target
 meets target;
  does not meet target.
Compared to a Single Value
 lower than the comparison value;
 higher than the comparison value;
 not statistically different from comparison value.
Trend

 non-significant change over time;
 significant change over time;
  no change over time.
Compared to Prior Value
 higher than the previous measurement period;
 lower than the previous measurement period;
 no statistically different change from previous measurement period.
County: Alameda
Health / Alcohol & Drug Use
Value
Compared to:
County: Alameda Adults who Binge Drink: Last 30 Days
County: Alameda Adults who Binge Drink: Last 30 Days
14.3%
(2021)
Compared to:
CA Counties
The distribution is based on data from 58 California counties.
U.S. Counties
The distribution is based on data from 3,074 U.S. counties and county equivalents.
US Value
(15.5%)
The regional value is compared to the national value.
County: Alameda Age-Adjusted Annual Opioid Prescription Rate
County: Alameda Age-Adjusted Annual Opioid Prescription Rate
236.0
Prescriptions per 1,000 residents
(2022)
Compared to:
CA Counties
The distribution is based on data from 58 California counties.
CA Value
(291.0)
The regional value is compared to the California state value.
Prior Value
(263.9)
Prior Value compares a measured value with the previously measured value. Confidence intervals were taken into account in determining the direction of the comparison.
Trend
This comparison measures the indicator’s values over multiple time periods.<br>The Mann-Kendall Test for Statistical Significance is used to evaluate the trend<br>over 4 to 10 periods of measure, subject to data availability and comparability.
County: Alameda Age-Adjusted Buprenorphine Prescription Rate
County: Alameda Age-Adjusted Buprenorphine Prescription Rate
14.9
Prescriptions per 1,000 residents
(2022)
Compared to:


CA Value
(19.8)
The regional value is compared to the California state value.
Prior Value
(13.8)
Prior Value compares a measured value with the previously measured value. Confidence intervals were taken into account in determining the direction of the comparison.
Trend
This comparison measures the indicator’s values over multiple time periods.<br>The Mann-Kendall Test for Statistical Significance is used to evaluate the trend<br>over 4 to 10 periods of measure, subject to data availability and comparability.
County: Alameda Age-Adjusted Death Rate due to All Opioid Overdose
County: Alameda Age-Adjusted Death Rate due to All Opioid Overdose
13.2
Rate per 100,000 residents
(2022)
Compared to:


CA Counties
The distribution is based on data from 58 California counties.
CA Value
(18.7)
The regional value is compared to the California state value.
Prior Value
(11.4)
Prior Value compares a measured value with the previously measured value. Confidence intervals were not taken into account in determining the direction of the comparison.
Trend
This comparison measures the indicator’s values over multiple time periods.<br>The Mann-Kendall Test for Statistical Significance is used to evaluate the trend<br>over 4 to 10 periods of measure, subject to data availability and comparability.
County: Alameda Age-Adjusted Death Rate due to Drug Use
County: Alameda Age-Adjusted Death Rate due to Drug Use
16.9
Deaths per 100,000 population
(2019-2021)
Compared to:
CA Counties
The distribution is based on data from 57 California counties.
CA Value
(21.4)
The regional value is compared to the California state value.
Prior Value
(15.4)
Prior Value compares a measured value with the previously measured value. Confidence intervals were taken into account in determining the direction of the comparison.
Trend
This comparison measures the indicator’s values over multiple time periods.<br>The Mann-Kendall Test for Statistical Significance is used to evaluate the trend<br>over 4 to 10 periods of measure, subject to data availability and comparability.
County: Alameda Age-Adjusted Death Rate due to Fentanyl Overdose
County: Alameda Age-Adjusted Death Rate due to Fentanyl Overdose
11.7
(2022)
Compared to:
CA Counties
The distribution is based on data from 58 California counties.
CA Value
(16.6)
The regional value is compared to the California state value.
Prior Value
(9.1)
Prior Value compares a measured value with the previously measured value. Confidence intervals were not taken into account in determining the direction of the comparison.
Trend
This comparison measures the indicator’s values over multiple time periods.<br>The Mann-Kendall Test for Statistical Significance is used to evaluate the trend<br>over 4 to 10 periods of measure, subject to data availability and comparability.
County: Alameda Age-Adjusted Death Rate due to Heroin Overdose
County: Alameda Age-Adjusted Death Rate due to Heroin Overdose
2.0
Deaths per 100,000 population
(2022)
Compared to:

CA Counties
(2018)
The distribution is based on data from 58 California counties.
CA Value
(1.2)
The regional value is compared to the California state value.
Prior Value
(1.0)
Prior Value compares a measured value with the previously measured value. Confidence intervals were not taken into account in determining the direction of the comparison.
Trend
This comparison measures the indicator’s values over multiple time periods.<br>The Mann-Kendall Test for Statistical Significance is used to evaluate the trend<br>over 4 to 10 periods of measure, subject to data availability and comparability.
HP 2030 Target
(4.2)
County: Alameda Age-Adjusted Death Rate due to Prescription Opioid Overdose
County: Alameda Age-Adjusted Death Rate due to Prescription Opioid Overdose
12.5
Rate per 100,000 residents
(2022)
Compared to:
CA Counties
The distribution is based on data from 58 California counties.
CA Value
(18.1)
The regional value is compared to the California state value.
Prior Value
(11.1)
Prior Value compares a measured value with the previously measured value. Confidence intervals were not taken into account in determining the direction of the comparison.
Trend
This comparison measures the indicator’s values over multiple time periods.<br>The Mann-Kendall Test for Statistical Significance is used to evaluate the trend<br>over 4 to 10 periods of measure, subject to data availability and comparability.
11.8
Rate per 100,000 residents
(2022)
Compared to:
CA Counties
The distribution is based on data from 58 California counties.
CA Value
(16.7)
The regional value is compared to the California state value.
Prior Value
(9.3)
Prior Value compares a measured value with the previously measured value. Confidence intervals were not taken into account in determining the direction of the comparison.
Trend
This comparison measures the indicator’s values over multiple time periods.<br>The Mann-Kendall Test for Statistical Significance is used to evaluate the trend<br>over 4 to 10 periods of measure, subject to data availability and comparability.
HP 2030 Target
(8.9)
<div>IVP-22: Reduce overdose deaths involving synthetic opioids other than methadone</div>
County: Alameda Age-Adjusted Drug and Opioid-Involved Overdose Death Rate
County: Alameda Age-Adjusted Drug and Opioid-Involved Overdose Death Rate
14.1
Deaths per 100,000 population
(2018-2020)
Compared to:
CA Counties
The distribution is based on data from 48 California counties.
U.S. Counties
The distribution is based on data from 1,303 U.S. counties and county equivalents.
CA Value
(16.5)
The regional value is compared to the California state value.
US Value
(23.5)
The regional value is compared to the national value.
Prior Value
(11.5)
Prior Value compares a measured value with the previously measured value. Confidence intervals were taken into account in determining the direction of the comparison.
County: Alameda Age-Adjusted ED Visit Rate due to All Drug Overdose
County: Alameda Age-Adjusted ED Visit Rate due to All Drug Overdose
97.8
Rate per 100,000 residents
(2022)
Compared to:

CA Counties
The distribution is based on data from 58 California counties.
CA Value
(143.7)
The regional value is compared to the California state value.
Prior Value
(94.3)
Prior Value compares a measured value with the previously measured value. Confidence intervals were not taken into account in determining the direction of the comparison.
Trend
This comparison measures the indicator’s values over multiple time periods.<br>The Mann-Kendall Test for Statistical Significance is used to evaluate the trend<br>over 4 to 10 periods of measure, subject to data availability and comparability.
County: Alameda Age-Adjusted ED Visit Rate due to Heroin Overdose
County: Alameda Age-Adjusted ED Visit Rate due to Heroin Overdose
3.1
Rate per 100,000 residents
(2022)
Compared to:
CA Counties
The distribution is based on data from 58 California counties.
CA Value
(3.6)
The regional value is compared to the California state value.
Prior Value
(1.4)
Prior Value compares a measured value with the previously measured value. Confidence intervals were not taken into account in determining the direction of the comparison.
Trend
This comparison measures the indicator’s values over multiple time periods.<br>The Mann-Kendall Test for Statistical Significance is used to evaluate the trend<br>over 4 to 10 periods of measure, subject to data availability and comparability.
30.1
Rate per 100,000 residents
(2022)
Compared to:
CA Counties
The distribution is based on data from 58 California counties.
CA Value
(54.9)
The regional value is compared to the California state value.
Prior Value
(5.9)
Prior Value compares a measured value with the previously measured value. Confidence intervals were not taken into account in determining the direction of the comparison.
Trend
This comparison measures the indicator’s values over multiple time periods.<br>The Mann-Kendall Test for Statistical Significance is used to evaluate the trend<br>over 4 to 10 periods of measure, subject to data availability and comparability.
County: Alameda Age-Adjusted Hospitalization Rate due to All Drug Overdose
County: Alameda Age-Adjusted Hospitalization Rate due to All Drug Overdose
39.1
Rate per 100,000 residents
(2022)
Compared to:
CA Counties
The distribution is based on data from 58 California counties.
CA Value
(48.3)
The regional value is compared to the California state value.
Prior Value
(36.2)
Prior Value compares a measured value with the previously measured value. Confidence intervals were not taken into account in determining the direction of the comparison.
Trend
This comparison measures the indicator’s values over multiple time periods.<br>The Mann-Kendall Test for Statistical Significance is used to evaluate the trend<br>over 4 to 10 periods of measure, subject to data availability and comparability.
County: Alameda Age-Adjusted Hospitalization Rate due to Heroin Overdose
County: Alameda Age-Adjusted Hospitalization Rate due to Heroin Overdose
1.1
Rate per 100,000 residents
(2022)
Compared to:
CA Counties
The distribution is based on data from 58 California counties.
CA Value
(0.7)
The regional value is compared to the California state value.
Prior Value
(1.4)
Prior Value compares a measured value with the previously measured value. Confidence intervals were not taken into account in determining the direction of the comparison.
Trend
This comparison measures the indicator’s values over multiple time periods.<br>The Mann-Kendall Test for Statistical Significance is used to evaluate the trend<br>over 4 to 10 periods of measure, subject to data availability and comparability.
7.6
Rate per 100,000 residents
(2022)
Compared to:
CA Counties
The distribution is based on data from 58 California counties.
CA Value
(12.1)
The regional value is compared to the California state value.
Prior Value
(5.9)
Prior Value compares a measured value with the previously measured value. Confidence intervals were not taken into account in determining the direction of the comparison.
Trend
This comparison measures the indicator’s values over multiple time periods.<br>The Mann-Kendall Test for Statistical Significance is used to evaluate the trend<br>over 4 to 10 periods of measure, subject to data availability and comparability.
1.0
Per 100,000 population
(2022)
Compared to:
CA Counties
The distribution is based on data from 58 California counties.
CA Value
(1.2)
The regional value is compared to the California state value.
Prior Value
(1.3)
Prior Value compares a measured value with the previously measured value. Confidence intervals were taken into account in determining the direction of the comparison.
Trend
This comparison measures the indicator’s values over multiple time periods.<br>The Mann-Kendall Test for Statistical Significance is used to evaluate the trend<br>over 4 to 10 periods of measure, subject to data availability and comparability.
County: Alameda Opioid Prescription Patients
County: Alameda Opioid Prescription Patients
1.7%
(Q3 2022)
Compared to:
CA Counties
(Q2 2022)
The distribution is based on data from 58 California counties.
Prior Value
(1.7%)
Prior Value compares a measured value with the previously measured value. Confidence intervals were not taken into account in determining the direction of the comparison.
Trend
This comparison measures the indicator’s values over multiple time periods.<br>The Mann-Kendall Test for Statistical Significance is used to evaluate the trend<br>over 4 to 10 periods of measure, subject to data availability and comparability.
County: Alameda Quarterly Opioid Prescription Rate
County: Alameda Quarterly Opioid Prescription Rate
220.9
Prescriptions per 10,000 population
(Q3 2022)
Compared to:
CA Counties
(Q2 2022)
The distribution is based on data from 58 California counties.
Prior Value
(218.8)
Prior Value compares a measured value with the previously measured value. Confidence intervals were not taken into account in determining the direction of the comparison.
Trend
This comparison measures the indicator’s values over multiple time periods.<br>The Mann-Kendall Test for Statistical Significance is used to evaluate the trend<br>over 4 to 10 periods of measure, subject to data availability and comparability.
5.0
Residents on >90 MMEs of Opioids per 1,000 residents
(2022)
Compared to:
CA Counties
The distribution is based on data from 58 California counties.
CA Value
(6.3)
The regional value is compared to the California state value.
Prior Value
(6.2)
Prior Value compares a measured value with the previously measured value. Confidence intervals were taken into account in determining the direction of the comparison.
Trend
This comparison measures the indicator’s values over multiple time periods.<br>The Mann-Kendall Test for Statistical Significance is used to evaluate the trend<br>over 4 to 10 periods of measure, subject to data availability and comparability.
County: Alameda Substance Use Emergency Department Visit Rate
County: Alameda Substance Use Emergency Department Visit Rate
1,537.2
Per 100,000 population
(2016-2018)
Compared to:
CA Value
(1,275.4 in 2012-2014)
The Alameda County value is compared to the 2013 CA State value.
Prior Value
(1,642.7)
Prior Value compares a measured value with the previously measured value. Confidence intervals were taken into account in determining the direction of the comparison.
Trend
This comparison measures the indicator’s values over multiple time periods.<br>The Mann-Kendall Test for Statistical Significance is used to evaluate the trend<br>over 4 to 10 periods of measure, subject to data availability and comparability.
County: Alameda
Health / Cancer
Value
Compared to:
County: Alameda Adults with Cancer
County: Alameda Adults with Cancer
5.5%
(2021)
Compared to:
CA Counties
The distribution is based on data from 58 California counties.
U.S. Counties
The distribution is based on data from 3,074 U.S. counties and county equivalents.
US Value
(7.0%)
The regional value is compared to the national value.
County: Alameda Age-Adjusted Death Rate due to Breast Cancer
County: Alameda Age-Adjusted Death Rate due to Breast Cancer
16.6
Deaths per 100,000 females
(2019-2021)
Compared to:
CA Counties
The distribution is based on data from 56 California counties.
CA Value
(17.8)
The regional value is compared to the California state value.
US Value
(20.0 in 2016)
The regional value is compared to the national value. The source for the national value is National Cancer Institute
Prior Value
(16.6)
Prior Value compares a measured value with the previously measured value. Confidence intervals were taken into account in determining the direction of the comparison.
Trend
This comparison measures the indicator’s values over multiple time periods.<br>The Mann-Kendall Test for Statistical Significance is used to evaluate the trend<br>over 4 to 10 periods of measure, subject to data availability and comparability.
HP 2030 Target
(15.3)
County: Alameda Age-Adjusted Death Rate due to Cancer
County: Alameda Age-Adjusted Death Rate due to Cancer
115.0
Deaths per 100,000 population
(2019-2021)
Compared to:
CA Counties
The distribution is based on data from 58 California counties.
CA Value
(124.9)
The regional value is compared to the California state value.
US Value
(155.9 in 2016)
The regional value is compared to the national value. The source for the national value is National Cancer Institute
Prior Value
(118.1)
Prior Value compares a measured value with the previously measured value. Confidence intervals were taken into account in determining the direction of the comparison.
Trend
This comparison measures the indicator’s values over multiple time periods.<br>The Mann-Kendall Test for Statistical Significance is used to evaluate the trend<br>over 4 to 10 periods of measure, subject to data availability and comparability.
HP 2030 Target
(122.7)
County: Alameda Age-Adjusted Death Rate due to Colorectal Cancer
County: Alameda Age-Adjusted Death Rate due to Colorectal Cancer
10.6
Deaths per 100,000 population
(2019-2021)
Compared to:
CA Counties
The distribution is based on data from 58 California counties.
CA Value
(11.7)
The regional value is compared to the California state value.
US Value
(13.7 in 2016)
The regional value is compared to the national value. The source for the national value is National Cancer Institute
Prior Value
(11.2)
Prior Value compares a measured value with the previously measured value. Confidence intervals were taken into account in determining the direction of the comparison.
Trend
This comparison measures the indicator’s values over multiple time periods.<br>The Mann-Kendall Test for Statistical Significance is used to evaluate the trend<br>over 4 to 10 periods of measure, subject to data availability and comparability.
HP 2030 Target
(8.9)
County: Alameda Age-Adjusted Death Rate due to Lung Cancer
County: Alameda Age-Adjusted Death Rate due to Lung Cancer
20.4
Deaths per 100,000 population
(2019-2021)
Compared to:
CA Counties
The distribution is based on data from 58 California counties.
CA Value
(21.6)
The regional value is compared to the California state value.
US Value
(38.5 in 2016)
The regional value is compared to the national value. The source for the national value is National Cancer Institute
Prior Value
(21.4)
Prior Value compares a measured value with the previously measured value. Confidence intervals were taken into account in determining the direction of the comparison.
Trend
This comparison measures the indicator’s values over multiple time periods.<br>The Mann-Kendall Test for Statistical Significance is used to evaluate the trend<br>over 4 to 10 periods of measure, subject to data availability and comparability.
HP 2030 Target
(25.1)
County: Alameda Age-Adjusted Death Rate due to Prostate Cancer
County: Alameda Age-Adjusted Death Rate due to Prostate Cancer
16.6
Deaths per 100,000 males
(2019-2021)
Compared to:
CA Counties
The distribution is based on data from 57 California counties.
CA Value
(18.4)
The regional value is compared to the California state value.
US Value
(19.4 in 2016)
The regional value is compared to the national value. The source for the national value is National Cancer Institute
Prior Value
(18.4)
Prior Value compares a measured value with the previously measured value. Confidence intervals were taken into account in determining the direction of the comparison.
Trend
This comparison measures the indicator’s values over multiple time periods.<br>The Mann-Kendall Test for Statistical Significance is used to evaluate the trend<br>over 4 to 10 periods of measure, subject to data availability and comparability.
HP 2030 Target
(16.9)
County: Alameda Breast Cancer Incidence Rate
County: Alameda Breast Cancer Incidence Rate
120.9
Cases per 100,000 females
(2016-2020)
Compared to:
CA Counties
The distribution is based on data from 56 California counties.
U.S. Counties
The distribution is based on data from 2,478 U.S. counties and county equivalents.
CA Value
(121.0)
The regional value is compared to the California state value.
US Value
(127.0)
The regional value is compared to the national value.
Prior Value
(122.6)
Prior Value compares a measured value with the previously measured value. Confidence intervals were taken into account in determining the direction of the comparison.
Trend
This comparison measures the indicator’s values over multiple time periods.<br>The Mann-Kendall Test for Statistical Significance is used to evaluate the trend<br>over 4 to 10 periods of measure, subject to data availability and comparability.
County: Alameda Cancer: Medicare Population
County: Alameda Cancer: Medicare Population
11.0%
(2022)
Compared to:
CA Counties
The distribution is based on data from 58 California counties.
U.S. Counties
The distribution is based on data from 3,129 U.S. counties and county equivalents.
CA Value
(11.0%)
The regional value is compared to the California state value.
US Value
(12.0%)
The regional value is compared to the national value.
Prior Value
(11.0%)
Prior Value compares a measured value with the previously measured value. Confidence intervals were not taken into account in determining the direction of the comparison.
Trend
This comparison measures the indicator’s values over multiple time periods.<br>The Mann-Kendall Test for Statistical Significance is used to evaluate the trend<br>over 4 to 10 periods of measure, subject to data availability and comparability.
County: Alameda Cervical Cancer Incidence Rate
County: Alameda Cervical Cancer Incidence Rate
5.2
Cases per 100,000 females
(2016-2020)
Compared to:
CA Counties
The distribution is based on data from 40 California counties.
U.S. Counties
The distribution is based on data from 696 U.S. counties and county equivalents.
CA Value
(7.3)
The regional value is compared to the California state value.
US Value
(7.5)
The regional value is compared to the national value.
Prior Value
(5.5)
Prior Value compares a measured value with the previously measured value. Confidence intervals were taken into account in determining the direction of the comparison.
Trend
This comparison measures the indicator’s values over multiple time periods.<br>The Mann-Kendall Test for Statistical Significance is used to evaluate the trend<br>over 4 to 10 periods of measure, subject to data availability and comparability.
County: Alameda Cervical Cancer Screening: 21-65
County: Alameda Cervical Cancer Screening: 21-65
79.0%
(2020)
Compared to:

CA Counties
The distribution is based on data from 58 California counties.
U.S. Counties
The distribution is based on data from 3,141 U.S. counties and county equivalents.
US Value
(82.8%)
The regional value is compared to the national value.
67.7%
(2018)
Compared to:
CA Counties
The distribution is based on data from 58 California counties.
U.S. Counties
The distribution is based on data from 3,142 U.S. counties and county equivalents.
US Value
(66.4%)
The regional value is compared to the national value.
County: Alameda Colon Cancer Screening: USPSTF Recommendation
County: Alameda Colon Cancer Screening: USPSTF Recommendation
61.0%
(2020)
Compared to:

CA Counties
The distribution is based on data from 58 California counties.
U.S. Counties
The distribution is based on data from 3,141 U.S. counties and county equivalents.
US Value
(72.4%)
The regional value is compared to the national value.
County: Alameda Colorectal Cancer Incidence Rate
County: Alameda Colorectal Cancer Incidence Rate
31.5
Cases per 100,000 population
(2016-2020)
Compared to:
CA Counties
The distribution is based on data from 56 California counties.
U.S. Counties
The distribution is based on data from 2,401 U.S. counties and county equivalents.
CA Value
(33.5)
The regional value is compared to the California state value.
US Value
(36.5)
The regional value is compared to the national value.
Prior Value
(32.6)
Prior Value compares a measured value with the previously measured value. Confidence intervals were taken into account in determining the direction of the comparison.
Trend
This comparison measures the indicator’s values over multiple time periods.<br>The Mann-Kendall Test for Statistical Significance is used to evaluate the trend<br>over 4 to 10 periods of measure, subject to data availability and comparability.
County: Alameda Lung and Bronchus Cancer Incidence Rate
County: Alameda Lung and Bronchus Cancer Incidence Rate
37.0
Cases per 100,000 population
(2016-2020)
Compared to:
CA Counties
The distribution is based on data from 55 California counties.
U.S. Counties
The distribution is based on data from 2,471 U.S. counties and county equivalents.
CA Value
(37.6)
The regional value is compared to the California state value.
US Value
(54.0)
The regional value is compared to the national value.
Prior Value
(38.6)
Prior Value compares a measured value with the previously measured value. Confidence intervals were taken into account in determining the direction of the comparison.
Trend
This comparison measures the indicator’s values over multiple time periods.<br>The Mann-Kendall Test for Statistical Significance is used to evaluate the trend<br>over 4 to 10 periods of measure, subject to data availability and comparability.
County: Alameda Mammogram in Past 2 Years: 50-74
County: Alameda Mammogram in Past 2 Years: 50-74
71.6%
(2020)
Compared to:
CA Counties
The distribution is based on data from 58 California counties.
U.S. Counties
The distribution is based on data from 3,141 U.S. counties and county equivalents.
US Value
(78.2%)
The regional value is compared to the national value.
HP 2030 Target
(80.3%)
County: Alameda Mammography Screening: Medicare Population
County: Alameda Mammography Screening: Medicare Population
41.0%
(2022)
Compared to:

CA Counties
The distribution is based on data from 58 California counties.
U.S. Counties
The distribution is based on data from 3,123 U.S. counties and county equivalents.
CA Value
(41.0%)
The regional value is compared to the California state value.
US Value
(47.0%)
The regional value is compared to the national value.
Prior Value
(42.0%)
Prior Value compares a measured value with the previously measured value. Confidence intervals were not taken into account in determining the direction of the comparison.
Trend
This comparison measures the indicator’s values over multiple time periods.<br>The Mann-Kendall Test for Statistical Significance is used to evaluate the trend<br>over 4 to 10 periods of measure, subject to data availability and comparability.
County: Alameda Oral Cavity and Pharynx Cancer Incidence Rate
County: Alameda Oral Cavity and Pharynx Cancer Incidence Rate
9.4
Cases per 100,000 population
(2016-2020)
Compared to:
CA Counties
The distribution is based on data from 54 California counties.
U.S. Counties
The distribution is based on data from 1,706 U.S. counties and county equivalents.
CA Value
(10.1)
The regional value is compared to the California state value.
US Value
(11.9)
The regional value is compared to the national value.
Prior Value
(9.7)
Prior Value compares a measured value with the previously measured value. Confidence intervals were taken into account in determining the direction of the comparison.
Trend
This comparison measures the indicator’s values over multiple time periods.<br>The Mann-Kendall Test for Statistical Significance is used to evaluate the trend<br>over 4 to 10 periods of measure, subject to data availability and comparability.
County: Alameda Prostate Cancer Incidence Rate
County: Alameda Prostate Cancer Incidence Rate
89.3
Cases per 100,000 males
(2016-2020)
Compared to:
CA Counties
The distribution is based on data from 57 California counties.
U.S. Counties
The distribution is based on data from 2,500 U.S. counties and county equivalents.
CA Value
(95.4)
The regional value is compared to the California state value.
US Value
(110.5)
The regional value is compared to the national value.
Prior Value
(92.2)
Prior Value compares a measured value with the previously measured value. Confidence intervals were taken into account in determining the direction of the comparison.
Trend
This comparison measures the indicator’s values over multiple time periods.<br>The Mann-Kendall Test for Statistical Significance is used to evaluate the trend<br>over 4 to 10 periods of measure, subject to data availability and comparability.
County: Alameda
Health / Diabetes
Value
Compared to:
County: Alameda Adults with Diabetes
County: Alameda Adults with Diabetes
11.5%
(2021-2022)
Compared to:
CA Counties
The distribution is based on data from 58 California counties.
CA Value
(10.7%)
The regional value is compared to the California state value.
US Value
(11.5% in 2022)
The regional value is compared to the national value. The source for the national value is Behavioral Risk Factor Surveillance System
Prior Value
(11.8%)
Prior Value compares a measured value with the previously measured value. Confidence intervals were taken into account in determining the direction of the comparison.
Trend
This comparison measures the indicator’s values over multiple time periods.<br>The Mann-Kendall Test for Statistical Significance is used to evaluate the trend<br>over 4 to 10 periods of measure, subject to data availability and comparability.
County: Alameda Age-Adjusted Death Rate due to Diabetes
County: Alameda Age-Adjusted Death Rate due to Diabetes
18.5
Deaths per 100,000 population
(2019-2021)
Compared to:
CA Counties
The distribution is based on data from 57 California counties.
CA Value
(23.1)
The regional value is compared to the California state value.
US Value
(24.8 in 2020)
The regional value is compared to the national value. The source for the national value is Centers for Disease Control and Prevention
Prior Value
(18.2)
Prior Value compares a measured value with the previously measured value. Confidence intervals were taken into account in determining the direction of the comparison.
Trend
This comparison measures the indicator’s values over multiple time periods.<br>The Mann-Kendall Test for Statistical Significance is used to evaluate the trend<br>over 4 to 10 periods of measure, subject to data availability and comparability.
County: Alameda Diabetes Hospitalization Rate
County: Alameda Diabetes Hospitalization Rate
879.6
Per 100,000 population
(2012-2014)
Compared to:
CA Value
(1,017.7)
The Alameda County value is compared to the 2013 CA State value.
Prior Value
(939.4)
Prior Value compares a measured value with the previously measured value. Confidence intervals were taken into account in determining the direction of the comparison.
Trend
This comparison measures the indicator’s values over multiple time periods.<br>The Mann-Kendall Test for Statistical Significance is used to evaluate the trend<br>over 4 to 10 periods of measure, subject to data availability and comparability.
County: Alameda Diabetes: Medicare Population
County: Alameda Diabetes: Medicare Population
22.0%
(2022)
Compared to:
CA Counties
The distribution is based on data from 58 California counties.
U.S. Counties
The distribution is based on data from 3,129 U.S. counties and county equivalents.
CA Value
(21.0%)
The regional value is compared to the California state value.
US Value
(24.0%)
The regional value is compared to the national value.
Prior Value
(21.0%)
Prior Value compares a measured value with the previously measured value. Confidence intervals were not taken into account in determining the direction of the comparison.
Trend
This comparison measures the indicator’s values over multiple time periods.<br>The Mann-Kendall Test for Statistical Significance is used to evaluate the trend<br>over 4 to 10 periods of measure, subject to data availability and comparability.
County: Alameda
Health / Disabilities
Value
Compared to:
County: Alameda Adults with Disability
County: Alameda Adults with Disability
23.1%
(2016)
Compared to:


CA Value
(29.7%)
The regional value is compared to the California state value.
US Value
(20.6% in 2015)
The regional value is compared to the national value. The source for the national value is Behavioral Risk Factor Surveillance System
Prior Value
(24.0%)
Prior Value compares a measured value with the previously measured value. Confidence intervals were taken into account in determining the direction of the comparison.
Trend
This comparison measures the indicator’s values over multiple time periods.<br>The Mann-Kendall Test for Statistical Significance is used to evaluate the trend<br>over 4 to 10 periods of measure, subject to data availability and comparability.
County: Alameda Adults with Disability Living in Poverty
County: Alameda Adults with Disability Living in Poverty
21.5%
(2018-2022)
Compared to:
CA Counties
The distribution is based on data from 58 California counties.
U.S. Counties
The distribution is based on data from 3,132 U.S. counties and county equivalents.
CA Value
(22.7%)
The regional value is compared to the California state value.
US Value
(24.9%)
The regional value is compared to the national value.
Trend
This comparison measures the indicator’s values over multiple time periods.<br>The Mann-Kendall Test for Statistical Significance is used to evaluate the trend<br>over 4 to 10 periods of measure, subject to data availability and comparability.
County: Alameda Children with a Disability
County: Alameda Children with a Disability
3.0%
(2018-2022)
Compared to:
CA Value
(3.7%)
The regional value is compared to the California state value.
US Value
(4.5%)
The regional value is compared to the national value.
Trend
This comparison measures the indicator’s values over multiple time periods.<br>The Mann-Kendall Test for Statistical Significance is used to evaluate the trend<br>over 4 to 10 periods of measure, subject to data availability and comparability.
County: Alameda Persons with a Cognitive Difficulty
County: Alameda Persons with a Cognitive Difficulty
4.0%
(2018-2022)
Compared to:

CA Value
(4.6%)
The regional value is compared to the California state value.
US Value
(5.3%)
The regional value is compared to the national value.
Trend
This comparison measures the indicator’s values over multiple time periods.<br>The Mann-Kendall Test for Statistical Significance is used to evaluate the trend<br>over 4 to 10 periods of measure, subject to data availability and comparability.
County: Alameda Persons with a Disability
County: Alameda Persons with a Disability
9.5%
(2018-2022)
Compared to:
CA Value
(11.0%)
The regional value is compared to the California state value.
US Value
(12.9%)
The regional value is compared to the national value.
Trend
This comparison measures the indicator’s values over multiple time periods.<br>The Mann-Kendall Test for Statistical Significance is used to evaluate the trend<br>over 4 to 10 periods of measure, subject to data availability and comparability.
County: Alameda Persons with a Hearing Difficulty
County: Alameda Persons with a Hearing Difficulty
2.3%
(2018-2022)
Compared to:

CA Value
(2.9%)
The regional value is compared to the California state value.
US Value
(3.6%)
The regional value is compared to the national value.
Trend
This comparison measures the indicator’s values over multiple time periods.<br>The Mann-Kendall Test for Statistical Significance is used to evaluate the trend<br>over 4 to 10 periods of measure, subject to data availability and comparability.
County: Alameda Persons with a Self-Care Difficulty
County: Alameda Persons with a Self-Care Difficulty
2.3%
(2018-2022)
Compared to:
CA Value
(2.7%)
The regional value is compared to the California state value.
US Value
(2.6%)
The regional value is compared to the national value.
Trend
This comparison measures the indicator’s values over multiple time periods.<br>The Mann-Kendall Test for Statistical Significance is used to evaluate the trend<br>over 4 to 10 periods of measure, subject to data availability and comparability.
County: Alameda Persons with a Vision Difficulty
County: Alameda Persons with a Vision Difficulty
1.8%
(2018-2022)
Compared to:
CA Value
(2.1%)
The regional value is compared to the California state value.
US Value
(2.4%)
The regional value is compared to the national value.
Trend
This comparison measures the indicator’s values over multiple time periods.<br>The Mann-Kendall Test for Statistical Significance is used to evaluate the trend<br>over 4 to 10 periods of measure, subject to data availability and comparability.
County: Alameda Persons with an Ambulatory Difficulty
County: Alameda Persons with an Ambulatory Difficulty
4.9%
(2018-2022)
Compared to:
CA Value
(5.8%)
The regional value is compared to the California state value.
US Value
(6.7%)
The regional value is compared to the national value.
Trend
This comparison measures the indicator’s values over multiple time periods.<br>The Mann-Kendall Test for Statistical Significance is used to evaluate the trend<br>over 4 to 10 periods of measure, subject to data availability and comparability.
County: Alameda
Health / Family Planning
Value
Compared to:
County: Alameda Teen Birth Rate: 15-19
County: Alameda Teen Birth Rate: 15-19
6.0
Live births per 1,000 females aged 15-19
(2019-2021)
Compared to:
CA Counties
The distribution is based on data from 55 California counties.
CA Value
(10.3)
The regional value is compared to the California state value.
US Value
(15.2)
The regional value is compared to the national value. The source for the national value is Centers for Disease Control and Prevention, National Center for Health Statistics
Prior Value
(6.2)
Prior Value compares a measured value with the previously measured value. Confidence intervals were taken into account in determining the direction of the comparison.
Trend
This comparison measures the indicator’s values over multiple time periods.<br>The Mann-Kendall Test for Statistical Significance is used to evaluate the trend<br>over 4 to 10 periods of measure, subject to data availability and comparability.
County: Alameda
Health / Health Care Access & Quality
Value
Compared to:
County: Alameda Adults Delayed or had Difficulty Obtaining Care
County: Alameda Adults Delayed or had Difficulty Obtaining Care
21.9%
(2019-2020)
Compared to:
CA Value
(22.0%)
The regional value is compared to the California state value.
Prior Value
(16.8%)
Prior Value compares a measured value with the previously measured value. Confidence intervals were taken into account in determining the direction of the comparison.
Trend
This comparison measures the indicator’s values over multiple time periods.<br>The Mann-Kendall Test for Statistical Significance is used to evaluate the trend<br>over 4 to 10 periods of measure, subject to data availability and comparability.
County: Alameda Adults who have had a Routine Checkup
County: Alameda Adults who have had a Routine Checkup
61.1%
(2021)
Compared to:
CA Counties
The distribution is based on data from 58 California counties.
U.S. Counties
The distribution is based on data from 3,074 U.S. counties and county equivalents.
US Value
(73.6%)
The regional value is compared to the national value.
County: Alameda Adults with Health Insurance: 18-64
County: Alameda Adults with Health Insurance: 18-64
93.6%
(2020-2022)
Compared to:
CA Counties
The distribution is based on data from 58 California counties.
CA Value
(91.2%)
The regional value is compared to the California state value.
Prior Value
(94.7%)
Prior Value compares a measured value with the previously measured value. Confidence intervals were taken into account in determining the direction of the comparison.
Trend
This comparison measures the indicator’s values over multiple time periods.<br>The Mann-Kendall Test for Statistical Significance is used to evaluate the trend<br>over 4 to 10 periods of measure, subject to data availability and comparability.
County: Alameda Adults without Health Insurance
County: Alameda Adults without Health Insurance
7.2%
(2021)
Compared to:
CA Counties
The distribution is based on data from 58 California counties.
U.S. Counties
The distribution is based on data from 3,074 U.S. counties and county equivalents.
US Value
(10.8%)
The regional value is compared to the national value.
County: Alameda Avoidable Emergency Department Visit Rate
County: Alameda Avoidable Emergency Department Visit Rate
3,740.6
Per 100,000 population
(2012-2014)
Compared to:
CA Value
(3,950.2)
The Alameda County value is compared to the 2013 CA State value.
Prior Value
(3,703.4)
Prior Value compares a measured value with the previously measured value. Confidence intervals were taken into account in determining the direction of the comparison.
Trend
This comparison measures the indicator’s values over multiple time periods.<br>The Mann-Kendall Test for Statistical Significance is used to evaluate the trend<br>over 4 to 10 periods of measure, subject to data availability and comparability.
County: Alameda Children and Teens Delayed or had Difficulty Obtaining Care
County: Alameda Children and Teens Delayed or had Difficulty Obtaining Care
8.9%
(2019-2020)
Compared to:
CA Value
(8.7%)
The regional value is compared to the California state value.
Prior Value
(2.3%)
Prior Value compares a measured value with the previously measured value. Confidence intervals were taken into account in determining the direction of the comparison.
County: Alameda Children with Health Insurance
County: Alameda Children with Health Insurance
97.3%
(2022)
Compared to:

CA Counties
The distribution is based on data from 42 California counties.
U.S. Counties
The distribution is based on data from 828 U.S. counties and county equivalents.
CA Value
(96.8%)
The regional value is compared to the California state value.
US Value
(94.9%)
The regional value is compared to the national value.
Prior Value
(97.4%)
Prior Value compares a measured value with the previously measured value. Confidence intervals were taken into account in determining the direction of the comparison.
Trend
This comparison measures the indicator’s values over multiple time periods.<br>The Mann-Kendall Test for Statistical Significance is used to evaluate the trend<br>over 4 to 10 periods of measure, subject to data availability and comparability.
County: Alameda Medicare Healthcare Costs
County: Alameda Medicare Healthcare Costs
$8,707
Dollars per enrollee
(2015)
Compared to:
CA Value
($9,100)
The regional value is compared to the California state value.
US Value
($9,729)
The regional value is compared to the national value.
Prior Value
($8,395)
Prior Value compares a measured value with the previously measured value. Confidence intervals were not taken into account in determining the direction of the comparison.
Trend
This comparison measures the indicator’s values over multiple time periods.<br>The Mann-Kendall Test for Statistical Significance is used to evaluate the trend<br>over 4 to 10 periods of measure, subject to data availability and comparability.
County: Alameda Non-Physician Primary Care Provider Rate
County: Alameda Non-Physician Primary Care Provider Rate
71
Providers per 100,000 population
(2023)
Compared to:
CA Counties
The distribution is based on data from 58 California counties.
U.S. Counties
The distribution is based on data from 3,129 U.S. counties and county equivalents.
CA Value
(87)
The regional value is compared to the California state value.
Prior Value
(67)
Prior Value compares a measured value with the previously measured value. Confidence intervals were not taken into account in determining the direction of the comparison.
Trend
This comparison measures the indicator’s values over multiple time periods.<br>The Mann-Kendall Test for Statistical Significance is used to evaluate the trend<br>over 4 to 10 periods of measure, subject to data availability and comparability.
County: Alameda People Delayed or had Difficulty Obtaining Care
County: Alameda People Delayed or had Difficulty Obtaining Care
17.6%
(2021-2022)
Compared to:
CA Counties
The distribution is based on data from 58 California counties.
CA Value
(16.5%)
The regional value is compared to the California state value.
Prior Value
(19.6%)
Prior Value compares a measured value with the previously measured value. Confidence intervals were taken into account in determining the direction of the comparison.
Trend
This comparison measures the indicator’s values over multiple time periods.<br>The Mann-Kendall Test for Statistical Significance is used to evaluate the trend<br>over 4 to 10 periods of measure, subject to data availability and comparability.
HP 2030 Target
(5.9%)
County: Alameda People with a Usual Source of Health Care
County: Alameda People with a Usual Source of Health Care
84.0%
(2022)
Compared to:
CA Counties
The distribution is based on data from 58 California counties.
CA Value
(82.5%)
The regional value is compared to the California state value.
Prior Value
(88.6%)
Prior Value compares a measured value with the previously measured value. Confidence intervals were taken into account in determining the direction of the comparison.
Trend
This comparison measures the indicator’s values over multiple time periods.<br>The Mann-Kendall Test for Statistical Significance is used to evaluate the trend<br>over 4 to 10 periods of measure, subject to data availability and comparability.
County: Alameda Persons with Health Insurance
County: Alameda Persons with Health Insurance
95.0%
(2021)
Compared to:
CA Counties
The distribution is based on data from 58 California counties.
U.S. Counties
The distribution is based on data from 3,140 U.S. counties and county equivalents.
CA Value
(91.9%)
The regional value is compared to the California state value.
Prior Value
(95.1%)
Prior Value compares a measured value with the previously measured value. Confidence intervals were taken into account in determining the direction of the comparison.
Trend
This comparison measures the indicator’s values over multiple time periods.<br>The Mann-Kendall Test for Statistical Significance is used to evaluate the trend<br>over 4 to 10 periods of measure, subject to data availability and comparability.
HP 2030 Target
(92.4%)
<div>AHS-01: Increase the proportion of people with health insurance <strong>(LEADING HEALTH INDICATOR)</strong></div>
County: Alameda Persons with Private Health Insurance Only
County: Alameda Persons with Private Health Insurance Only
65.6%
(2022)
Compared to:
CA Value
(53.5%)
The regional value is compared to the California state value.
US Value
(54.8%)
The regional value is compared to the national value.
Prior Value
(63.9%)
Prior Value compares a measured value with the previously measured value. Confidence intervals were not taken into account in determining the direction of the comparison.
Trend
This comparison measures the indicator’s values over multiple time periods.<br>The Mann-Kendall Test for Statistical Significance is used to evaluate the trend<br>over 4 to 10 periods of measure, subject to data availability and comparability.
County: Alameda Persons with Public Health Insurance Only
County: Alameda Persons with Public Health Insurance Only
20.7%
(2022)
Compared to:

CA Value
(29.8%)
The regional value is compared to the California state value.
US Value
(24.8%)
The regional value is compared to the national value.
Prior Value
(21.6%)
Prior Value compares a measured value with the previously measured value. Confidence intervals were not taken into account in determining the direction of the comparison.
Trend
This comparison measures the indicator’s values over multiple time periods.<br>The Mann-Kendall Test for Statistical Significance is used to evaluate the trend<br>over 4 to 10 periods of measure, subject to data availability and comparability.
County: Alameda Preventable Hospital Stays: Medicare Population
County: Alameda Preventable Hospital Stays: Medicare Population
2,135.0
Discharges per 100,000 Medicare enrollees
(2022)
Compared to:
CA Counties
The distribution is based on data from 58 California counties.
U.S. Counties
The distribution is based on data from 3,129 U.S. counties and county equivalents.
CA Value
(2,275.0)
The regional value is compared to the California state value.
US Value
(2,677.0)
The regional value is compared to the national value.
Prior Value
(2,109.0)
Prior Value compares a measured value with the previously measured value. Confidence intervals were not taken into account in determining the direction of the comparison.
Trend
This comparison measures the indicator’s values over multiple time periods.<br>The Mann-Kendall Test for Statistical Significance is used to evaluate the trend<br>over 4 to 10 periods of measure, subject to data availability and comparability.
County: Alameda Primary Care Provider Rate
County: Alameda Primary Care Provider Rate
112
Providers per 100,000 population
(2021)
Compared to:
CA Counties
The distribution is based on data from 57 California counties.
U.S. Counties
The distribution is based on data from 2,984 U.S. counties and county equivalents.
CA Value
(81)
The regional value is compared to the California state value.
Prior Value
(113)
Prior Value compares a measured value with the previously measured value. Confidence intervals were not taken into account in determining the direction of the comparison.
Trend
This comparison measures the indicator’s values over multiple time periods.<br>The Mann-Kendall Test for Statistical Significance is used to evaluate the trend<br>over 4 to 10 periods of measure, subject to data availability and comparability.
County: Alameda
Health / Health Information Technology
Value
Compared to:
County: Alameda Households with an Internet Subscription
County: Alameda Households with an Internet Subscription
93.0%
(2018-2022)
Compared to:
CA Counties
The distribution is based on data from 58 California counties.
U.S. Counties
The distribution is based on data from 3,133 U.S. counties and county equivalents.
CA Value
(91.6%)
The regional value is compared to the California state value.
US Value
(88.5%)
The regional value is compared to the national value.
Trend
This comparison measures the indicator’s values over multiple time periods.<br>The Mann-Kendall Test for Statistical Significance is used to evaluate the trend<br>over 4 to 10 periods of measure, subject to data availability and comparability.
County: Alameda Households with One or More Types of Computing Devices
County: Alameda Households with One or More Types of Computing Devices
96.4%
(2018-2022)
Compared to:
CA Counties
The distribution is based on data from 58 California counties.
U.S. Counties
The distribution is based on data from 3,133 U.S. counties and county equivalents.
CA Value
(95.9%)
The regional value is compared to the California state value.
US Value
(94.0%)
The regional value is compared to the national value.
Trend
This comparison measures the indicator’s values over multiple time periods.<br>The Mann-Kendall Test for Statistical Significance is used to evaluate the trend<br>over 4 to 10 periods of measure, subject to data availability and comparability.
County: Alameda Persons with an Internet Subscription
County: Alameda Persons with an Internet Subscription
94.6%
(2018-2022)
Compared to:
CA Counties
The distribution is based on data from 58 California counties.
U.S. Counties
The distribution is based on data from 3,133 U.S. counties and county equivalents.
CA Value
(93.4%)
The regional value is compared to the California state value.
US Value
(91.0%)
The regional value is compared to the national value.
Trend
This comparison measures the indicator’s values over multiple time periods.<br>The Mann-Kendall Test for Statistical Significance is used to evaluate the trend<br>over 4 to 10 periods of measure, subject to data availability and comparability.
County: Alameda
Health / Heart Disease & Stroke
Value
Compared to:
County: Alameda Adults who Experienced a Stroke
County: Alameda Adults who Experienced a Stroke
2.5%
(2021)
Compared to:
CA Counties
The distribution is based on data from 58 California counties.
U.S. Counties
The distribution is based on data from 3,074 U.S. counties and county equivalents.
US Value
(3.3%)
The regional value is compared to the national value.
County: Alameda Adults who Experienced Coronary Heart Disease
County: Alameda Adults who Experienced Coronary Heart Disease
4.4%
(2021)
Compared to:
CA Counties
The distribution is based on data from 58 California counties.
U.S. Counties
The distribution is based on data from 3,074 U.S. counties and county equivalents.
US Value
(6.1%)
The regional value is compared to the national value.
County: Alameda Adults who Have Taken Medications for High Blood Pressure
County: Alameda Adults who Have Taken Medications for High Blood Pressure
72.1%
(2021)
Compared to:
CA Counties
The distribution is based on data from 58 California counties.
U.S. Counties
The distribution is based on data from 3,074 U.S. counties and county equivalents.
US Value
(78.2%)
The regional value is compared to the national value.
County: Alameda Adults with Heart Disease
County: Alameda Adults with Heart Disease
5.9%
(2019-2020)
Compared to:
CA Value
(6.9%)
The regional value is compared to the California state value.
Prior Value
(5.6%)
Prior Value compares a measured value with the previously measured value. Confidence intervals were taken into account in determining the direction of the comparison.
Trend
This comparison measures the indicator’s values over multiple time periods.<br>The Mann-Kendall Test for Statistical Significance is used to evaluate the trend<br>over 4 to 10 periods of measure, subject to data availability and comparability.
County: Alameda Age-Adjusted Death Rate due to Cerebrovascular Disease (Stroke)
County: Alameda Age-Adjusted Death Rate due to Cerebrovascular Disease (Stroke)
40.0
Deaths per 100,000 population
(2019-2021)
Compared to:
CA Counties
The distribution is based on data from 58 California counties.
CA Value
(37.2)
The regional value is compared to the California state value.
US Value
(38.8 in 2020)
The regional value is compared to the national value. The source for the national value is Centers for Disease Control and Prevention
Prior Value
(39.1)
Prior Value compares a measured value with the previously measured value. Confidence intervals were taken into account in determining the direction of the comparison.
Trend
This comparison measures the indicator’s values over multiple time periods.<br>The Mann-Kendall Test for Statistical Significance is used to evaluate the trend<br>over 4 to 10 periods of measure, subject to data availability and comparability.
HP 2030 Target
(33.4)
County: Alameda Age-Adjusted Death Rate due to Coronary Heart Disease
County: Alameda Age-Adjusted Death Rate due to Coronary Heart Disease
56.5
Deaths per 100,000 population
(2019-2021)
Compared to:
CA Counties
The distribution is based on data from 58 California counties.
CA Value
(79.0)
The regional value is compared to the California state value.
US Value
(91.8 in 2020)
The regional value is compared to the national value. The source for the national value is Centers for Disease Control and Prevention
Prior Value
(56.3)
Prior Value compares a measured value with the previously measured value. Confidence intervals were taken into account in determining the direction of the comparison.
Trend
This comparison measures the indicator’s values over multiple time periods.<br>The Mann-Kendall Test for Statistical Significance is used to evaluate the trend<br>over 4 to 10 periods of measure, subject to data availability and comparability.
HP 2030 Target
(71.1)
County: Alameda Age-Adjusted Death Rate due to Heart Attack
County: Alameda Age-Adjusted Death Rate due to Heart Attack
37.0
Deaths per 100,000 population 35+ years
(2020)
Compared to:
CA Counties
The distribution is based on data from 49 California counties.
CA Value
(44.4)
The regional value is compared to the California state value.
Prior Value
(34.8)
Prior Value compares a measured value with the previously measured value. Confidence intervals were not taken into account in determining the direction of the comparison.
Trend
This comparison measures the indicator’s values over multiple time periods.<br>The Mann-Kendall Test for Statistical Significance is used to evaluate the trend<br>over 4 to 10 periods of measure, subject to data availability and comparability.
County: Alameda Age-Adjusted Hospitalization Rate due to Heart Attack
County: Alameda Age-Adjusted Hospitalization Rate due to Heart Attack
21.4
Hospitalizations per 10,000 population 35+ years
(2018)
Compared to:
CA Counties
The distribution is based on data from 56 California counties.
CA Value
(25.5)
The regional value is compared to the California state value.
Prior Value
(21.9)
Prior Value compares a measured value with the previously measured value. Confidence intervals were not taken into account in determining the direction of the comparison.
Trend
This comparison measures the indicator’s values over multiple time periods.<br>The Mann-Kendall Test for Statistical Significance is used to evaluate the trend<br>over 4 to 10 periods of measure, subject to data availability and comparability.
County: Alameda Atrial Fibrillation: Medicare Population
County: Alameda Atrial Fibrillation: Medicare Population
11.0%
(2022)
Compared to:
CA Counties
The distribution is based on data from 58 California counties.
U.S. Counties
The distribution is based on data from 3,129 U.S. counties and county equivalents.
CA Value
(13.0%)
The regional value is compared to the California state value.
US Value
(14.0%)
The regional value is compared to the national value.
Prior Value
(11.0%)
Prior Value compares a measured value with the previously measured value. Confidence intervals were not taken into account in determining the direction of the comparison.
Trend
This comparison measures the indicator’s values over multiple time periods.<br>The Mann-Kendall Test for Statistical Significance is used to evaluate the trend<br>over 4 to 10 periods of measure, subject to data availability and comparability.
County: Alameda Cholesterol Test History
County: Alameda Cholesterol Test History
85.6%
(2021)
Compared to:
CA Counties
The distribution is based on data from 58 California counties.
U.S. Counties
The distribution is based on data from 3,074 U.S. counties and county equivalents.
US Value
(86.4%)
The regional value is compared to the national value.
County: Alameda Congesitve Heart Failure Hospitalizations
County: Alameda Congesitve Heart Failure Hospitalizations
195.9
Per 100,000 population
(2012-2014)
Compared to:
CA Value
(174.1)
The Alameda County value is compared to the 2013 CA State value.
Prior Value
(183.1)
Prior Value compares a measured value with the previously measured value. Confidence intervals were taken into account in determining the direction of the comparison.
Trend
This comparison measures the indicator’s values over multiple time periods.<br>The Mann-Kendall Test for Statistical Significance is used to evaluate the trend<br>over 4 to 10 periods of measure, subject to data availability and comparability.
County: Alameda Coronary Heart Disease Hospitalization Rate
County: Alameda Coronary Heart Disease Hospitalization Rate
232.8
Per 100,000 population
(2012-2014)
Compared to:
CA Value
(247.2)
The Alameda County value is compared to the 2013 CA State value.
Prior Value
(270.2)
Prior Value compares a measured value with the previously measured value. Confidence intervals were taken into account in determining the direction of the comparison.
Trend
This comparison measures the indicator’s values over multiple time periods.<br>The Mann-Kendall Test for Statistical Significance is used to evaluate the trend<br>over 4 to 10 periods of measure, subject to data availability and comparability.
County: Alameda Heart Failure: Medicare Population
County: Alameda Heart Failure: Medicare Population
9.0%
(2022)
Compared to:
CA Counties
The distribution is based on data from 58 California counties.
U.S. Counties
The distribution is based on data from 3,129 U.S. counties and county equivalents.
CA Value
(10.0%)
The regional value is compared to the California state value.
US Value
(11.0%)
The regional value is compared to the national value.
Prior Value
(9.0%)
Prior Value compares a measured value with the previously measured value. Confidence intervals were not taken into account in determining the direction of the comparison.
Trend
This comparison measures the indicator’s values over multiple time periods.<br>The Mann-Kendall Test for Statistical Significance is used to evaluate the trend<br>over 4 to 10 periods of measure, subject to data availability and comparability.
County: Alameda High Blood Pressure Prevalence
County: Alameda High Blood Pressure Prevalence
30.1%
(2022)
Compared to:
CA Counties
The distribution is based on data from 58 California counties.
CA Value
(34.8%)
The regional value is compared to the California state value.
US Value
(32.4% in 2021)
The regional value is compared to the national value. The source for the national value is Behavioral Risk Factor Surveillance System
Prior Value
(26.6%)
Prior Value compares a measured value with the previously measured value. Confidence intervals were taken into account in determining the direction of the comparison.
Trend
This comparison measures the indicator’s values over multiple time periods.<br>The Mann-Kendall Test for Statistical Significance is used to evaluate the trend<br>over 4 to 10 periods of measure, subject to data availability and comparability.
HP 2030 Target
(41.9%)
County: Alameda High Cholesterol Prevalence: Past 5 Years
County: Alameda High Cholesterol Prevalence: Past 5 Years
34.1%
(2021)
Compared to:
CA Counties
The distribution is based on data from 58 California counties.
U.S. Counties
The distribution is based on data from 3,074 U.S. counties and county equivalents.
US Value
(36.4%)
The regional value is compared to the national value.
County: Alameda Hyperlipidemia: Medicare Population
County: Alameda Hyperlipidemia: Medicare Population
59.0%
(2022)
Compared to:
CA Counties
The distribution is based on data from 58 California counties.
U.S. Counties
The distribution is based on data from 3,129 U.S. counties and county equivalents.
CA Value
(61.0%)
The regional value is compared to the California state value.
US Value
(65.0%)
The regional value is compared to the national value.
Prior Value
(57.0%)
Prior Value compares a measured value with the previously measured value. Confidence intervals were not taken into account in determining the direction of the comparison.
Trend
This comparison measures the indicator’s values over multiple time periods.<br>The Mann-Kendall Test for Statistical Significance is used to evaluate the trend<br>over 4 to 10 periods of measure, subject to data availability and comparability.
County: Alameda Hypertension: Medicare Population
County: Alameda Hypertension: Medicare Population
57.0%
(2022)
Compared to:
CA Counties
The distribution is based on data from 58 California counties.
U.S. Counties
The distribution is based on data from 3,129 U.S. counties and county equivalents.
CA Value
(58.0%)
The regional value is compared to the California state value.
US Value
(65.0%)
The regional value is compared to the national value.
Prior Value
(56.0%)
Prior Value compares a measured value with the previously measured value. Confidence intervals were not taken into account in determining the direction of the comparison.
Trend
This comparison measures the indicator’s values over multiple time periods.<br>The Mann-Kendall Test for Statistical Significance is used to evaluate the trend<br>over 4 to 10 periods of measure, subject to data availability and comparability.
County: Alameda Ischemic Heart Disease: Medicare Population
County: Alameda Ischemic Heart Disease: Medicare Population
14.0%
(2022)
Compared to:
CA Counties
The distribution is based on data from 58 California counties.
U.S. Counties
The distribution is based on data from 3,129 U.S. counties and county equivalents.
CA Value
(18.0%)
The regional value is compared to the California state value.
US Value
(21.0%)
The regional value is compared to the national value.
Prior Value
(14.0%)
Prior Value compares a measured value with the previously measured value. Confidence intervals were not taken into account in determining the direction of the comparison.
Trend
This comparison measures the indicator’s values over multiple time periods.<br>The Mann-Kendall Test for Statistical Significance is used to evaluate the trend<br>over 4 to 10 periods of measure, subject to data availability and comparability.
County: Alameda Stroke Hospitalization Rate
County: Alameda Stroke Hospitalization Rate
191.3
Per 100,000 population
(2012-2014)
Compared to:
CA Value
(215.5)
The Alameda County value is compared to the 2013 CA State value.
Prior Value
(221.6)
Prior Value compares a measured value with the previously measured value. Confidence intervals were taken into account in determining the direction of the comparison.
Trend
This comparison measures the indicator’s values over multiple time periods.<br>The Mann-Kendall Test for Statistical Significance is used to evaluate the trend<br>over 4 to 10 periods of measure, subject to data availability and comparability.
County: Alameda Stroke: Medicare Population
County: Alameda Stroke: Medicare Population
5.0%
(2022)
Compared to:
CA Counties
The distribution is based on data from 58 California counties.
U.S. Counties
The distribution is based on data from 3,129 U.S. counties and county equivalents.
CA Value
(5.0%)
The regional value is compared to the California state value.
US Value
(6.0%)
The regional value is compared to the national value.
Prior Value
(5.0%)
Prior Value compares a measured value with the previously measured value. Confidence intervals were not taken into account in determining the direction of the comparison.
Trend
This comparison measures the indicator’s values over multiple time periods.<br>The Mann-Kendall Test for Statistical Significance is used to evaluate the trend<br>over 4 to 10 periods of measure, subject to data availability and comparability.
County: Alameda
Health / Immunizations & Infectious Diseases
Value
Compared to:
County: Alameda Age-Adjusted Death Rate due to Influenza and Pneumonia
County: Alameda Age-Adjusted Death Rate due to Influenza and Pneumonia
9.4
Deaths per 100,000 population
(2019-2021)
Compared to:
CA Counties
The distribution is based on data from 57 California counties.
CA Value
(11.5)
The regional value is compared to the California state value.
US Value
(13.0 in 2020)
The regional value is compared to the national value. The source for the national value is Centers for Disease Control and Prevention
Prior Value
(11.8)
Prior Value compares a measured value with the previously measured value. Confidence intervals were taken into account in determining the direction of the comparison.
Trend
This comparison measures the indicator’s values over multiple time periods.<br>The Mann-Kendall Test for Statistical Significance is used to evaluate the trend<br>over 4 to 10 periods of measure, subject to data availability and comparability.
County: Alameda COVID-19 Daily Average Case-Fatality Rate
County: Alameda COVID-19 Daily Average Case-Fatality Rate
0.8
Deaths per 100 cases
(Mar 3, 2023)
Compared to:
CA Counties
(Feb 3, 2023)
The distribution is based on data from 56 California counties.
U.S. Counties
(Mar 25, 2022)
The distribution is based on data from 2,811 U.S. counties and county equivalents.
CA Value
(1.0)
The regional value is compared to the California state value.
US Value
(1.7)
The regional value is compared to the national value.
Prior Value
(0.0)
Prior Value compares a measured value with the previously measured value. Confidence intervals were not taken into account in determining the direction of the comparison.
Trend
This comparison measures the indicator’s values over multiple time periods.<br>The Mann-Kendall Test for Statistical Significance is used to evaluate the trend<br>over 4 to 10 periods of measure, subject to data availability and comparability.
County: Alameda COVID-19 Daily Average Incidence Rate
County: Alameda COVID-19 Daily Average Incidence Rate
10.40
Cases per 100,000 population
(Mar 3, 2023)
Compared to:
CA Counties
The distribution is based on data from 58 California counties.
U.S. Counties
The distribution is based on data from 3,142 U.S. counties and county equivalents.
CA Value
(6.23)
The regional value is compared to the California state value.
US Value
(10.97)
The regional value is compared to the national value.
Prior Value
(8.86)
Prior Value compares a measured value with the previously measured value. Confidence intervals were not taken into account in determining the direction of the comparison.
Trend
This comparison measures the indicator’s values over multiple time periods.<br>The Mann-Kendall Test for Statistical Significance is used to evaluate the trend<br>over 4 to 10 periods of measure, subject to data availability and comparability.
County: Alameda Flu Vaccinations: Medicare Population
County: Alameda Flu Vaccinations: Medicare Population
54.0%
(2022)
Compared to:
CA Counties
The distribution is based on data from 58 California counties.
U.S. Counties
The distribution is based on data from 3,129 U.S. counties and county equivalents.
CA Value
(48.0%)
The regional value is compared to the California state value.
US Value
(50.0%)
The regional value is compared to the national value.
Prior Value
(51.0%)
Prior Value compares a measured value with the previously measured value. Confidence intervals were not taken into account in determining the direction of the comparison.
Trend
This comparison measures the indicator’s values over multiple time periods.<br>The Mann-Kendall Test for Statistical Significance is used to evaluate the trend<br>over 4 to 10 periods of measure, subject to data availability and comparability.
County: Alameda Kindergartners with Required Immunizations
County: Alameda Kindergartners with Required Immunizations
95.1%
(2021-2022)
Compared to:
CA Counties
The distribution is based on data from 56 California counties.
CA Value
(92.8%)
The regional value is compared to the California state value.
Prior Value
(90.3%)
Prior Value compares a measured value with the previously measured value. Confidence intervals were not taken into account in determining the direction of the comparison.
Trend
This comparison measures the indicator’s values over multiple time periods.<br>The Mann-Kendall Test for Statistical Significance is used to evaluate the trend<br>over 4 to 10 periods of measure, subject to data availability and comparability.
County: Alameda Persons Fully Vaccinated Against COVID-19
County: Alameda Persons Fully Vaccinated Against COVID-19
86.2%
(May 10, 2023)
Compared to:
CA Counties
The distribution is based on data from 50 California counties.
U.S. Counties
The distribution is based on data from 3,125 U.S. counties and county equivalents.
Prior Value
(86.2%)
Prior Value compares a measured value with the previously measured value. Confidence intervals were not taken into account in determining the direction of the comparison.
Trend
This comparison measures the indicator’s values over multiple time periods.<br>The Mann-Kendall Test for Statistical Significance is used to evaluate the trend<br>over 4 to 10 periods of measure, subject to data availability and comparability.
County: Alameda Pneumonia Vaccinations: Medicare Population
County: Alameda Pneumonia Vaccinations: Medicare Population
9.0%
(2022)
Compared to:

CA Counties
The distribution is based on data from 58 California counties.
U.S. Counties
The distribution is based on data from 3,129 U.S. counties and county equivalents.
CA Value
(8.0%)
The regional value is compared to the California state value.
US Value
(8.0%)
The regional value is compared to the national value.
Prior Value
(7.0%)
Prior Value compares a measured value with the previously measured value. Confidence intervals were not taken into account in determining the direction of the comparison.
Trend
This comparison measures the indicator’s values over multiple time periods.<br>The Mann-Kendall Test for Statistical Significance is used to evaluate the trend<br>over 4 to 10 periods of measure, subject to data availability and comparability.
County: Alameda Tuberculosis Incidence Rate
County: Alameda Tuberculosis Incidence Rate
8.4
Cases per 100,000 population
(2022)
Compared to:
CA Counties
(2019)
The distribution is based on data from 31 California counties.
CA Value
(4.7)
The regional value is compared to the California state value.
US Value
(2.4 in 2021)
The regional value is compared to the national value. The source for the national value is Centers for Disease Control and Prevention
Prior Value
(6.5)
Prior Value compares a measured value with the previously measured value. Confidence intervals were not taken into account in determining the direction of the comparison.
Trend
This comparison measures the indicator’s values over multiple time periods.<br>The Mann-Kendall Test for Statistical Significance is used to evaluate the trend<br>over 4 to 10 periods of measure, subject to data availability and comparability.
HP 2030 Target
(1.4)
County: Alameda
Health / Maternal, Fetal & Infant Health
Value
Compared to:
County: Alameda Any In-Hospital Breastfeeding
County: Alameda Any In-Hospital Breastfeeding
96.8%
(2022)
Compared to:
CA Counties
The distribution is based on data from 58 California counties.
CA Value
(93.8%)
The regional value is compared to the California state value.
Prior Value
(96.4%)
Prior Value compares a measured value with the previously measured value. Confidence intervals were taken into account in determining the direction of the comparison.
Trend
This comparison measures the indicator’s values over multiple time periods.<br>The Mann-Kendall Test for Statistical Significance is used to evaluate the trend<br>over 4 to 10 periods of measure, subject to data availability and comparability.
County: Alameda Babies with Low Birthweight
County: Alameda Babies with Low Birthweight
7.2%
(2019-2021)
Compared to:
CA Counties
The distribution is based on data from 56 California counties.
CA Value
(7.1%)
The regional value is compared to the California state value.
US Value
(8.5% in 2021)
The regional value is compared to the national value. The source for the national value is Centers for Disease Control and Prevention
Prior Value
(7.2%)
Prior Value compares a measured value with the previously measured value. Confidence intervals were taken into account in determining the direction of the comparison.
Trend
This comparison measures the indicator’s values over multiple time periods.<br>The Mann-Kendall Test for Statistical Significance is used to evaluate the trend<br>over 4 to 10 periods of measure, subject to data availability and comparability.
County: Alameda Babies with Very Low Birthweight
County: Alameda Babies with Very Low Birthweight
1.1%
(2018)
Compared to:
CA Counties
The distribution is based on data from 58 California counties.
CA Value
(1.1%)
The regional value is compared to the California state value.
US Value
(1.4%)
The regional value is compared to the national value. The source for the national value is Centers for Disease Control and Prevention
Prior Value
(1.2%)
Prior Value compares a measured value with the previously measured value. Confidence intervals were taken into account in determining the direction of the comparison.
Trend
This comparison measures the indicator’s values over multiple time periods.<br>The Mann-Kendall Test for Statistical Significance is used to evaluate the trend<br>over 4 to 10 periods of measure, subject to data availability and comparability.
County: Alameda In-Hospital Exclusive Breastfeeding
County: Alameda In-Hospital Exclusive Breastfeeding
77.8%
(2022)
Compared to:
CA Counties
The distribution is based on data from 58 California counties.
CA Value
(68.5%)
The regional value is compared to the California state value.
Prior Value
(77.1%)
Prior Value compares a measured value with the previously measured value. Confidence intervals were taken into account in determining the direction of the comparison.
Trend
This comparison measures the indicator’s values over multiple time periods.<br>The Mann-Kendall Test for Statistical Significance is used to evaluate the trend<br>over 4 to 10 periods of measure, subject to data availability and comparability.
County: Alameda Infant Mortality Rate
County: Alameda Infant Mortality Rate
3.3
Deaths per 1,000 live births
(2017-2019)
Compared to:
CA Value
(3.9)
The regional value is compared to the California state value.
US Value
(5.7)
The regional value is compared to the national value. The source for the national value is Centers for Disease Control and Prevention
Prior Value
(3.5)
Prior Value compares a measured value with the previously measured value. Confidence intervals were taken into account in determining the direction of the comparison.
Trend
This comparison measures the indicator’s values over multiple time periods.<br>The Mann-Kendall Test for Statistical Significance is used to evaluate the trend<br>over 4 to 10 periods of measure, subject to data availability and comparability.
HP 2030 Target
(5.0)
<div>MICH-02: Reduce the rate of infant deaths <strong>(LEADING HEALTH INDICATOR)</strong></div>
County: Alameda Mothers who Breastfeed
County: Alameda Mothers who Breastfeed
96.8%
(2018-2020)
Compared to:
CA Counties
The distribution is based on data from 58 California counties.
CA Value
(93.8%)
The regional value is compared to the California state value.
Prior Value
(97.3%)
Prior Value compares a measured value with the previously measured value. Confidence intervals were taken into account in determining the direction of the comparison.
Trend
This comparison measures the indicator’s values over multiple time periods.<br>The Mann-Kendall Test for Statistical Significance is used to evaluate the trend<br>over 4 to 10 periods of measure, subject to data availability and comparability.
County: Alameda Mothers who Received Early Prenatal Care
County: Alameda Mothers who Received Early Prenatal Care
91.7%
(2019-2021)
Compared to:
CA Counties
The distribution is based on data from 58 California counties.
CA Value
(87.9%)
The regional value is compared to the California state value.
US Value
(78.3% in 2021)
The regional value is compared to the national value. The source for the national value is Centers for Disease Control and Prevention
Prior Value
(91.3%)
Prior Value compares a measured value with the previously measured value. Confidence intervals were taken into account in determining the direction of the comparison.
Trend
This comparison measures the indicator’s values over multiple time periods.<br>The Mann-Kendall Test for Statistical Significance is used to evaluate the trend<br>over 4 to 10 periods of measure, subject to data availability and comparability.
County: Alameda Preterm Births
County: Alameda Preterm Births
8.5%
(2020-2022)
Compared to:
CA Counties
The distribution is based on data from 58 California counties.
CA Value
(9.0%)
The regional value is compared to the California state value.
Prior Value
(8.7%)
Prior Value compares a measured value with the previously measured value. Confidence intervals were taken into account in determining the direction of the comparison.
Trend
This comparison measures the indicator’s values over multiple time periods.<br>The Mann-Kendall Test for Statistical Significance is used to evaluate the trend<br>over 4 to 10 periods of measure, subject to data availability and comparability.
HP 2030 Target
(9.4%)
County: Alameda
Health / Mental Health & Mental Disorders
Value
Compared to:
County: Alameda Adults Ever Diagnosed with Depression
County: Alameda Adults Ever Diagnosed with Depression
15.9%
(2021)
Compared to:
CA Counties
The distribution is based on data from 58 California counties.
U.S. Counties
The distribution is based on data from 3,074 U.S. counties and county equivalents.
US Value
(19.5%)
The regional value is compared to the national value.
County: Alameda Adults Needing and Receiving Behavioral Health Care Services
County: Alameda Adults Needing and Receiving Behavioral Health Care Services
63.2%
(2021-2022)
Compared to:
CA Counties
The distribution is based on data from 58 California counties.
CA Value
(55.9%)
The regional value is compared to the California state value.
Prior Value
(60.2%)
Prior Value compares a measured value with the previously measured value. Confidence intervals were taken into account in determining the direction of the comparison.
Trend
This comparison measures the indicator’s values over multiple time periods.<br>The Mann-Kendall Test for Statistical Significance is used to evaluate the trend<br>over 4 to 10 periods of measure, subject to data availability and comparability.
County: Alameda Adults with Likely Serious Psychological Distress
County: Alameda Adults with Likely Serious Psychological Distress
18.8%
(2021-2022)
Compared to:
CA Counties
The distribution is based on data from 58 California counties.
CA Value
(16.7%)
The regional value is compared to the California state value.
Prior Value
(15.7%)
Prior Value compares a measured value with the previously measured value. Confidence intervals were taken into account in determining the direction of the comparison.
Trend
This comparison measures the indicator’s values over multiple time periods.<br>The Mann-Kendall Test for Statistical Significance is used to evaluate the trend<br>over 4 to 10 periods of measure, subject to data availability and comparability.
County: Alameda Age-Adjusted Death Rate due to Suicide
County: Alameda Age-Adjusted Death Rate due to Suicide
8.6
Deaths per 100,000 population
(2019-2021)
Compared to:
CA Counties
The distribution is based on data from 57 California counties.
CA Value
(10.3)
The regional value is compared to the California state value.
US Value
(13.5 in 2020)
The regional value is compared to the national value. The source for the national value is Centers for Disease Control and Prevention
Prior Value
(8.8)
Prior Value compares a measured value with the previously measured value. Confidence intervals were taken into account in determining the direction of the comparison.
Trend
This comparison measures the indicator’s values over multiple time periods.<br>The Mann-Kendall Test for Statistical Significance is used to evaluate the trend<br>over 4 to 10 periods of measure, subject to data availability and comparability.
HP 2030 Target
(12.8)
<div>MHMD-01: Reduce the suicide rate <strong>(LEADING HEALTH INDICATOR)</strong></div>
County: Alameda Depression: Medicare Population
County: Alameda Depression: Medicare Population
12.0%
(2022)
Compared to:
CA Counties
The distribution is based on data from 58 California counties.
U.S. Counties
The distribution is based on data from 3,129 U.S. counties and county equivalents.
CA Value
(14.0%)
The regional value is compared to the California state value.
US Value
(16.0%)
The regional value is compared to the national value.
Prior Value
(12.0%)
Prior Value compares a measured value with the previously measured value. Confidence intervals were not taken into account in determining the direction of the comparison.
Trend
This comparison measures the indicator’s values over multiple time periods.<br>The Mann-Kendall Test for Statistical Significance is used to evaluate the trend<br>over 4 to 10 periods of measure, subject to data availability and comparability.
County: Alameda Frequent Mental Distress
County: Alameda Frequent Mental Distress
11.2%
(2019)
Compared to:
CA Counties
The distribution is based on data from 58 California counties.
U.S. Counties
The distribution is based on data from 3,121 U.S. counties and county equivalents.
CA Value
(12.0%)
The regional value is compared to the California state value.
US Value
(14.0%)
The regional value is compared to the national value.
Prior Value
(10.8%)
Prior Value compares a measured value with the previously measured value. Confidence intervals were taken into account in determining the direction of the comparison.
County: Alameda Mental Health Provider Rate
County: Alameda Mental Health Provider Rate
751
Providers per 100,000 population
(2023)
Compared to:
CA Counties
The distribution is based on data from 58 California counties.
U.S. Counties
The distribution is based on data from 2,956 U.S. counties and county equivalents.
CA Value
(450)
The regional value is compared to the California state value.
Prior Value
(715)
Prior Value compares a measured value with the previously measured value. Confidence intervals were not taken into account in determining the direction of the comparison.
Trend
This comparison measures the indicator’s values over multiple time periods.<br>The Mann-Kendall Test for Statistical Significance is used to evaluate the trend<br>over 4 to 10 periods of measure, subject to data availability and comparability.
County: Alameda Poor Mental Health: 14+ Days
County: Alameda Poor Mental Health: 14+ Days
13.5%
(2021)
Compared to:
CA Counties
The distribution is based on data from 58 California counties.
U.S. Counties
The distribution is based on data from 3,074 U.S. counties and county equivalents.
US Value
(14.7%)
The regional value is compared to the national value.
County: Alameda Severe Mental Illness Related Emergency Department Visits
County: Alameda Severe Mental Illness Related Emergency Department Visits
2,285.9
Per 100,000 population
(2016-2018)
Compared to:
CA Value
(320.0 in 2012-2014)
The Alameda County value is compared to the 2013 CA State value.
Prior Value
(489.3)
Prior Value compares a measured value with the previously measured value. Confidence intervals were taken into account in determining the direction of the comparison.
Trend
This comparison measures the indicator’s values over multiple time periods.<br>The Mann-Kendall Test for Statistical Significance is used to evaluate the trend<br>over 4 to 10 periods of measure, subject to data availability and comparability.
County: Alameda
Health / Mortality Data
Value
Compared to:
County: Alameda Life Expectancy
County: Alameda Life Expectancy
82.2
Years
(2019-2021)
Compared to:
CA Counties
The distribution is based on data from 57 California counties.
U.S. Counties
The distribution is based on data from 3,070 U.S. counties and county equivalents.
CA Value
(79.9)
The regional value is compared to the California state value.
US Value
(77.6)
The regional value is compared to the national value.
County: Alameda
Health / Nutrition & Healthy Eating
Value
Compared to:
County: Alameda Adult Fast Food Consumption
County: Alameda Adult Fast Food Consumption
58.3%
(2016)
Compared to:
CA Counties
The distribution is based on data from 58 California counties.
CA Value
(65.6%)
The regional value is compared to the California state value.
Prior Value
(55.8%)
Prior Value compares a measured value with the previously measured value. Confidence intervals were taken into account in determining the direction of the comparison.
Trend
This comparison measures the indicator’s values over multiple time periods.<br>The Mann-Kendall Test for Statistical Significance is used to evaluate the trend<br>over 4 to 10 periods of measure, subject to data availability and comparability.
County: Alameda Adults who Drink Sugar-Sweetened Beverages
County: Alameda Adults who Drink Sugar-Sweetened Beverages
9.9%
(2019-2020)
Compared to:
CA Value
(13.7%)
The regional value is compared to the California state value.
Prior Value
(7.8%)
Prior Value compares a measured value with the previously measured value. Confidence intervals were taken into account in determining the direction of the comparison.
County: Alameda Child and Teen Fruit Consumption
County: Alameda Child and Teen Fruit Consumption
67.5%
(2019-2020)
Compared to:
CA Counties
The distribution is based on data from 58 California counties.
CA Value
(69.8%)
The regional value is compared to the California state value.
Prior Value
(64.3%)
Prior Value compares a measured value with the previously measured value. Confidence intervals were taken into account in determining the direction of the comparison.
Trend
This comparison measures the indicator’s values over multiple time periods.<br>The Mann-Kendall Test for Statistical Significance is used to evaluate the trend<br>over 4 to 10 periods of measure, subject to data availability and comparability.
County: Alameda
Health / Older Adults
Value
Compared to:
County: Alameda Adults 65+ who Received Recommended Preventive Services: Females
County: Alameda Adults 65+ who Received Recommended Preventive Services: Females
30.9%
(2020)
Compared to:
CA Counties
The distribution is based on data from 58 California counties.
U.S. Counties
The distribution is based on data from 3,141 U.S. counties and county equivalents.
US Value
(37.9%)
The regional value is compared to the national value.
County: Alameda Adults 65+ who Received Recommended Preventive Services: Males
County: Alameda Adults 65+ who Received Recommended Preventive Services: Males
38.2%
(2020)
Compared to:
CA Counties
The distribution is based on data from 58 California counties.
U.S. Counties
The distribution is based on data from 3,141 U.S. counties and county equivalents.
US Value
(43.7%)
The regional value is compared to the national value.
County: Alameda Adults 65+ with a Disability
County: Alameda Adults 65+ with a Disability
30.8%
(2018-2022)
Compared to:
CA Value
(33.5%)
The regional value is compared to the California state value.
US Value
(33.3%)
The regional value is compared to the national value.
Trend
This comparison measures the indicator’s values over multiple time periods.<br>The Mann-Kendall Test for Statistical Significance is used to evaluate the trend<br>over 4 to 10 periods of measure, subject to data availability and comparability.
County: Alameda Adults 65+ with a Hearing Difficulty
County: Alameda Adults 65+ with a Hearing Difficulty
11.1%
(2018-2022)
Compared to:
CA Value
(12.9%)
The regional value is compared to the California state value.
US Value
(13.7%)
The regional value is compared to the national value.
Trend
This comparison measures the indicator’s values over multiple time periods.<br>The Mann-Kendall Test for Statistical Significance is used to evaluate the trend<br>over 4 to 10 periods of measure, subject to data availability and comparability.
County: Alameda Adults 65+ with a Self-Care Difficulty
County: Alameda Adults 65+ with a Self-Care Difficulty
8.7%
(2018-2022)
Compared to:
CA Value
(9.5%)
The regional value is compared to the California state value.
US Value
(7.4%)
The regional value is compared to the national value.
Trend
This comparison measures the indicator’s values over multiple time periods.<br>The Mann-Kendall Test for Statistical Significance is used to evaluate the trend<br>over 4 to 10 periods of measure, subject to data availability and comparability.
County: Alameda Adults 65+ with a Vision Difficulty
County: Alameda Adults 65+ with a Vision Difficulty
5.5%
(2018-2022)
Compared to:
CA Value
(6.1%)
The regional value is compared to the California state value.
US Value
(6.0%)
The regional value is compared to the national value.
Trend
This comparison measures the indicator’s values over multiple time periods.<br>The Mann-Kendall Test for Statistical Significance is used to evaluate the trend<br>over 4 to 10 periods of measure, subject to data availability and comparability.
County: Alameda Adults 65+ with an Independent Living Difficulty
County: Alameda Adults 65+ with an Independent Living Difficulty
16.1%
(2018-2022)
Compared to:
CA Value
(16.4%)
The regional value is compared to the California state value.
US Value
(13.6%)
The regional value is compared to the national value.
Trend
This comparison measures the indicator’s values over multiple time periods.<br>The Mann-Kendall Test for Statistical Significance is used to evaluate the trend<br>over 4 to 10 periods of measure, subject to data availability and comparability.
County: Alameda Alzheimer's Disease or Dementia: Medicare Population
County: Alameda Alzheimer's Disease or Dementia: Medicare Population
6.0%
(2022)
Compared to:
CA Counties
The distribution is based on data from 58 California counties.
U.S. Counties
The distribution is based on data from 3,129 U.S. counties and county equivalents.
CA Value
(5.0%)
The regional value is compared to the California state value.
US Value
(6.0%)
The regional value is compared to the national value.
Prior Value
(6.0%)
Prior Value compares a measured value with the previously measured value. Confidence intervals were not taken into account in determining the direction of the comparison.
Trend
This comparison measures the indicator’s values over multiple time periods.<br>The Mann-Kendall Test for Statistical Significance is used to evaluate the trend<br>over 4 to 10 periods of measure, subject to data availability and comparability.
County: Alameda Elder Index (Elderly Household Below Income Threshold)
County: Alameda Elder Index (Elderly Household Below Income Threshold)
36.2%
(2019-2020)
Compared to:
CA Counties
The distribution is based on data from 58 California counties.
CA Value
(27.7%)
The regional value is compared to the California state value.
Prior Value
(37.9%)
Prior Value compares a measured value with the previously measured value. Confidence intervals were taken into account in determining the direction of the comparison.
Trend
This comparison measures the indicator’s values over multiple time periods.<br>The Mann-Kendall Test for Statistical Significance is used to evaluate the trend<br>over 4 to 10 periods of measure, subject to data availability and comparability.
County: Alameda
Health / Oral Health
Value
Compared to:
County: Alameda Adults 65+ with Total Tooth Loss
County: Alameda Adults 65+ with Total Tooth Loss
6.7%
(2020)
Compared to:
CA Counties
The distribution is based on data from 58 California counties.
U.S. Counties
The distribution is based on data from 3,141 U.S. counties and county equivalents.
US Value
(13.4%)
The regional value is compared to the national value.
County: Alameda Adults who Visited a Dentist
County: Alameda Adults who Visited a Dentist
63.1%
(2020)
Compared to:
CA Counties
The distribution is based on data from 58 California counties.
U.S. Counties
The distribution is based on data from 3,141 U.S. counties and county equivalents.
US Value
(64.8%)
The regional value is compared to the national value.
County: Alameda Children who Visited a Dentist
County: Alameda Children who Visited a Dentist
89.7%
(2019-2020)
Compared to:
CA Value
(89.5%)
The regional value is compared to the California state value.
Prior Value
(90.8%)
Prior Value compares a measured value with the previously measured value. Confidence intervals were taken into account in determining the direction of the comparison.
County: Alameda Dentist Rate
County: Alameda Dentist Rate
104
Dentists per 100,000 population
(2022)
Compared to:
CA Counties
The distribution is based on data from 58 California counties.
U.S. Counties
The distribution is based on data from 3,054 U.S. counties and county equivalents.
CA Value
(93)
The regional value is compared to the California state value.
Prior Value
(101)
Prior Value compares a measured value with the previously measured value. Confidence intervals were not taken into account in determining the direction of the comparison.
Trend
This comparison measures the indicator’s values over multiple time periods.<br>The Mann-Kendall Test for Statistical Significance is used to evaluate the trend<br>over 4 to 10 periods of measure, subject to data availability and comparability.
County: Alameda
Health / Other Conditions
Value
Compared to:
County: Alameda Acute Preventable Hospitalizations
County: Alameda Acute Preventable Hospitalizations
447.7
Per 100,000 population
(2009-2011)
Compared to:
CA Value
(500.63)
The Alameda County value is compared to the CA State value.
County: Alameda Adults with Arthritis
County: Alameda Adults with Arthritis
17.8%
(2021)
Compared to:
CA Counties
The distribution is based on data from 58 California counties.
U.S. Counties
The distribution is based on data from 3,074 U.S. counties and county equivalents.
US Value
(25.2%)
The regional value is compared to the national value.
County: Alameda Adults with Kidney Disease
County: Alameda Adults with Kidney Disease
2.7%
(2021)
Compared to:
CA Counties
The distribution is based on data from 58 California counties.
U.S. Counties
The distribution is based on data from 3,074 U.S. counties and county equivalents.
US Value
(3.1%)
The regional value is compared to the national value.
County: Alameda Chronic Kidney Disease: Medicare Population
County: Alameda Chronic Kidney Disease: Medicare Population
17.0%
(2022)
Compared to:
CA Counties
The distribution is based on data from 58 California counties.
U.S. Counties
The distribution is based on data from 3,129 U.S. counties and county equivalents.
CA Value
(16.0%)
The regional value is compared to the California state value.
US Value
(18.0%)
The regional value is compared to the national value.
Prior Value
(17.0%)
Prior Value compares a measured value with the previously measured value. Confidence intervals were not taken into account in determining the direction of the comparison.
Trend
This comparison measures the indicator’s values over multiple time periods.<br>The Mann-Kendall Test for Statistical Significance is used to evaluate the trend<br>over 4 to 10 periods of measure, subject to data availability and comparability.
County: Alameda Chronic Preventable Hospitalizations
County: Alameda Chronic Preventable Hospitalizations
787.5
Per 100,000 population
(2009-2011)
Compared to:
CA Value
(786.98)
The Alameda County value is compared to the CA State value.
County: Alameda Hypertension Hospitalizations
County: Alameda Hypertension Hospitalizations
986.4
Per 100,000 population
(2012-2014)
Compared to:
CA Value
(1,234.8)
The Alameda County value is compared to the 2013 CA State value.
Prior Value
(1,102.2)
Prior Value compares a measured value with the previously measured value. Confidence intervals were taken into account in determining the direction of the comparison.
Trend
This comparison measures the indicator’s values over multiple time periods.<br>The Mann-Kendall Test for Statistical Significance is used to evaluate the trend<br>over 4 to 10 periods of measure, subject to data availability and comparability.
County: Alameda Osteoporosis: Medicare Population
County: Alameda Osteoporosis: Medicare Population
13.0%
(2022)
Compared to:
CA Counties
The distribution is based on data from 58 California counties.
U.S. Counties
The distribution is based on data from 3,129 U.S. counties and county equivalents.
CA Value
(13.0%)
The regional value is compared to the California state value.
US Value
(11.0%)
The regional value is compared to the national value.
Prior Value
(12.0%)
Prior Value compares a measured value with the previously measured value. Confidence intervals were not taken into account in determining the direction of the comparison.
Trend
This comparison measures the indicator’s values over multiple time periods.<br>The Mann-Kendall Test for Statistical Significance is used to evaluate the trend<br>over 4 to 10 periods of measure, subject to data availability and comparability.
County: Alameda Rheumatoid Arthritis or Osteoarthritis: Medicare Population
County: Alameda Rheumatoid Arthritis or Osteoarthritis: Medicare Population
27.0%
(2022)
Compared to:
CA Counties
The distribution is based on data from 58 California counties.
U.S. Counties
The distribution is based on data from 3,129 U.S. counties and county equivalents.
CA Value
(32.0%)
The regional value is compared to the California state value.
US Value
(35.0%)
The regional value is compared to the national value.
Prior Value
(25.0%)
Prior Value compares a measured value with the previously measured value. Confidence intervals were not taken into account in determining the direction of the comparison.
Trend
This comparison measures the indicator’s values over multiple time periods.<br>The Mann-Kendall Test for Statistical Significance is used to evaluate the trend<br>over 4 to 10 periods of measure, subject to data availability and comparability.
County: Alameda Self-Inflicted Injury Emergency Department Visit Rate
County: Alameda Self-Inflicted Injury Emergency Department Visit Rate
103.1
Per 100,000 population
(2012-2014)
Compared to:
CA Value
(115.5)
The Alameda County value is compared to the 2013 California State value
Prior Value
(104.0)
Prior Value compares a measured value with the previously measured value. Confidence intervals were taken into account in determining the direction of the comparison.
Trend
This comparison measures the indicator’s values over multiple time periods.<br>The Mann-Kendall Test for Statistical Significance is used to evaluate the trend<br>over 4 to 10 periods of measure, subject to data availability and comparability.
County: Alameda
Health / Physical Activity
Value
Compared to:
County: Alameda 7th Grade Students who are Physically Fit
County: Alameda 7th Grade Students who are Physically Fit
67.3%
(2018-2019)
Compared to:
CA Counties
The distribution is based on data from 58 California counties.
CA Value
(61.0%)
The regional value is compared to the California state value.
Prior Value
(67.4%)
Prior Value compares a measured value with the previously measured value. Confidence intervals were not taken into account in determining the direction of the comparison.
Trend
This comparison measures the indicator’s values over multiple time periods.<br>The Mann-Kendall Test for Statistical Significance is used to evaluate the trend<br>over 4 to 10 periods of measure, subject to data availability and comparability.
County: Alameda Adults 20+ who are Sedentary
County: Alameda Adults 20+ who are Sedentary
14.9%
(2021)
Compared to:
CA Counties
The distribution is based on data from 58 California counties.
U.S. Counties
The distribution is based on data from 3,074 U.S. counties and county equivalents.
Prior Value
(14.1%)
Prior Value compares a measured value with the previously measured value. Confidence intervals were taken into account in determining the direction of the comparison.
Trend
This comparison measures the indicator’s values over multiple time periods.<br>The Mann-Kendall Test for Statistical Significance is used to evaluate the trend<br>over 4 to 10 periods of measure, subject to data availability and comparability.
County: Alameda Teens who Engage in Regular Physical Activity
County: Alameda Teens who Engage in Regular Physical Activity
68.4%
(2013-2014)
Compared to:
CA Counties
(2011-2012)
The distribution is based on data from 44 California counties and county groups.
CA Value
(69.6%)
The regional value is compared to the California state value.
Prior Value
(65.5%)
Prior Value compares a measured value with the previously measured value. Confidence intervals were taken into account in determining the direction of the comparison.
County: Alameda
Health / Prevention & Safety
Value
Compared to:
County: Alameda Age-Adjusted Death Rate due to Firearms
County: Alameda Age-Adjusted Death Rate due to Firearms
7.5
Deaths per 100,000 population
(2018-2020)
Compared to:
CA Counties
The distribution is based on data from 45 California counties.
U.S. Counties
The distribution is based on data from 1,083 U.S. counties and county equivalents.
CA Value
(7.4)
The regional value is compared to the California state value.
US Value
(12.0)
The regional value is compared to the national value.
Prior Value
(6.4)
Prior Value compares a measured value with the previously measured value. Confidence intervals were taken into account in determining the direction of the comparison.
Trend
This comparison measures the indicator’s values over multiple time periods.<br>The Mann-Kendall Test for Statistical Significance is used to evaluate the trend<br>over 4 to 10 periods of measure, subject to data availability and comparability.
HP 2030 Target
(10.7)
County: Alameda Age-Adjusted Death Rate due to Unintentional Injuries
County: Alameda Age-Adjusted Death Rate due to Unintentional Injuries
32.8
Deaths per 100,000 population
(2019-2021)
Compared to:
CA Counties
The distribution is based on data from 58 California counties.
CA Value
(43.4)
The regional value is compared to the California state value.
US Value
(57.6 in 2020)
The regional value is compared to the national value. The source for the national value is Centers for Disease Control and Prevention
Prior Value
(29.6)
Prior Value compares a measured value with the previously measured value. Confidence intervals were taken into account in determining the direction of the comparison.
Trend
This comparison measures the indicator’s values over multiple time periods.<br>The Mann-Kendall Test for Statistical Significance is used to evaluate the trend<br>over 4 to 10 periods of measure, subject to data availability and comparability.
HP 2030 Target
(43.2)
County: Alameda Motor Vehicle Crash Emergency Department Visit Rate
County: Alameda Motor Vehicle Crash Emergency Department Visit Rate
809.3
Per 100,000 population
(2012-2014)
Compared to:
CA Value
(747.3)
The Alameda County value is compared to the 2013 California State value
Prior Value
(789.6)
Prior Value compares a measured value with the previously measured value. Confidence intervals were taken into account in determining the direction of the comparison.
Trend
This comparison measures the indicator’s values over multiple time periods.<br>The Mann-Kendall Test for Statistical Significance is used to evaluate the trend<br>over 4 to 10 periods of measure, subject to data availability and comparability.
County: Alameda Unintentional Injury Emergency Department Visit Rate
County: Alameda Unintentional Injury Emergency Department Visit Rate
6,749.6
Per 100,000 population
(2012-2014)
Compared to:
CA Value
(6,531.7)
The Alameda County value is compared to the 2013 California State value
Prior Value
(6,747.7)
Prior Value compares a measured value with the previously measured value. Confidence intervals were taken into account in determining the direction of the comparison.
Trend
This comparison measures the indicator’s values over multiple time periods.<br>The Mann-Kendall Test for Statistical Significance is used to evaluate the trend<br>over 4 to 10 periods of measure, subject to data availability and comparability.
