
Advanced Search: Build a Custom Dashboard
In the fields below, search for indicators by location, topics, population, classification, subgroup, or comparison. No fields are required, but we suggest selecting a location or two to start. In the additional search options section, select options to group and order search results. To learn more about how to customize a dashboard, see our help center.
Visit the Indicator List Page to see the full list of indicators and locations available on the site.
Search Results:
Indicator Gauge Icon Legend
Legend Colors
Red is bad, green is good, blue is not statistically different/neutral.
Compared to Distribution
 the value is in the best half of communities.
 the value is in the 2nd worst quarter of communities.
 the value is in the worst quarter of communities.
Compared to Target
 meets target;
  does not meet target.
Compared to a Single Value
 lower than the comparison value;
 higher than the comparison value;
 not statistically different from comparison value.
Trend

 non-significant change over time;
 significant change over time;
  no change over time.
Compared to Prior Value
 higher than the previous measurement period;
 lower than the previous measurement period;
 no statistically different change from previous measurement period.
Health / Alcohol & Drug Use
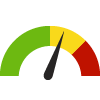
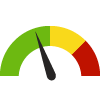
Adults who Binge Drink: Last 30 Days County: Alameda
Adults who Binge Drink: Last 30 Days County: Alameda
14.3%
(2021)
Compared to:
CA Counties
The distribution is based on data from 58 California counties.
U.S. Counties
The distribution is based on data from 3,074 U.S. counties and county equivalents.
US Value
(15.5%)
The regional value is compared to the national value.
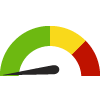
Adults who Binge Drink: Last 30 Days City/Place: Livermore
Adults who Binge Drink: Last 30 Days City/Place: Livermore
18.3%
(2021)
Compared to:


CA Census Places
The distribution is based on data from 1,472 locales.
U.S. Census Places
The distribution is based on data from 27,528 U.S. Census Places.
Alameda, CA County Value
(14.3%)
The regional value is compared to the Alameda County value.
US Value
(15.5%)
The regional value is compared to the national value.
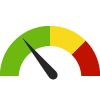
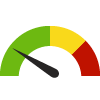
Age-Adjusted Annual Opioid Prescription Rate County: Alameda
Age-Adjusted Annual Opioid Prescription Rate County: Alameda
236.0
Prescriptions per 1,000 residents
(2022)
Compared to:
CA Counties
The distribution is based on data from 58 California counties.
CA Value
(291.0)
The regional value is compared to the California state value.
Prior Value
(263.9)
Prior Value compares a measured value with the previously measured value. Confidence intervals were taken into account in determining the direction of the comparison.
Trend
This comparison measures the indicator’s values over multiple time periods.<br>The Mann-Kendall Test for Statistical Significance is used to evaluate the trend<br>over 4 to 10 periods of measure, subject to data availability and comparability.
Age-Adjusted Buprenorphine Prescription Rate County: Alameda
Age-Adjusted Buprenorphine Prescription Rate County: Alameda
14.9
Prescriptions per 1,000 residents
(2022)
Compared to:


CA Value
(19.8)
The regional value is compared to the California state value.
Prior Value
(13.8)
Prior Value compares a measured value with the previously measured value. Confidence intervals were taken into account in determining the direction of the comparison.
Trend
This comparison measures the indicator’s values over multiple time periods.<br>The Mann-Kendall Test for Statistical Significance is used to evaluate the trend<br>over 4 to 10 periods of measure, subject to data availability and comparability.
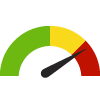
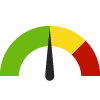
Age-Adjusted Death Rate due to All Opioid Overdose County: Alameda
Age-Adjusted Death Rate due to All Opioid Overdose County: Alameda
13.2
Rate per 100,000 residents
(2022)
Compared to:


CA Counties
The distribution is based on data from 58 California counties.
CA Value
(18.7)
The regional value is compared to the California state value.
Prior Value
(11.4)
Prior Value compares a measured value with the previously measured value. Confidence intervals were not taken into account in determining the direction of the comparison.
Trend
This comparison measures the indicator’s values over multiple time periods.<br>The Mann-Kendall Test for Statistical Significance is used to evaluate the trend<br>over 4 to 10 periods of measure, subject to data availability and comparability.
Age-Adjusted Death Rate due to Drug Use County: Alameda
Age-Adjusted Death Rate due to Drug Use County: Alameda
16.9
Deaths per 100,000 population
(2019-2021)
Compared to:
CA Counties
The distribution is based on data from 57 California counties.
CA Value
(21.4)
The regional value is compared to the California state value.
Prior Value
(15.4)
Prior Value compares a measured value with the previously measured value. Confidence intervals were taken into account in determining the direction of the comparison.
Trend
This comparison measures the indicator’s values over multiple time periods.<br>The Mann-Kendall Test for Statistical Significance is used to evaluate the trend<br>over 4 to 10 periods of measure, subject to data availability and comparability.
Health / Alcohol & Drug Use
Age-Adjusted Death Rate due to Prescription Opioid Overdose
Value
Compared to:
Age-Adjusted Death Rate due to Prescription Opioid Overdose County: Alameda
Age-Adjusted Death Rate due to Prescription Opioid Overdose County: Alameda
12.5
Rate per 100,000 residents
(2022)
Compared to:
CA Counties
The distribution is based on data from 58 California counties.
CA Value
(18.1)
The regional value is compared to the California state value.
Prior Value
(11.1)
Prior Value compares a measured value with the previously measured value. Confidence intervals were not taken into account in determining the direction of the comparison.
Trend
This comparison measures the indicator’s values over multiple time periods.<br>The Mann-Kendall Test for Statistical Significance is used to evaluate the trend<br>over 4 to 10 periods of measure, subject to data availability and comparability.
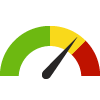
Age-Adjusted ED Visit Rate due to All Drug Overdose County: Alameda
Age-Adjusted ED Visit Rate due to All Drug Overdose County: Alameda
97.8
Rate per 100,000 residents
(2022)
Compared to:

CA Counties
The distribution is based on data from 58 California counties.
CA Value
(143.7)
The regional value is compared to the California state value.
Prior Value
(94.3)
Prior Value compares a measured value with the previously measured value. Confidence intervals were not taken into account in determining the direction of the comparison.
Trend
This comparison measures the indicator’s values over multiple time periods.<br>The Mann-Kendall Test for Statistical Significance is used to evaluate the trend<br>over 4 to 10 periods of measure, subject to data availability and comparability.
Age-Adjusted ED Visit Rate due to Heroin Overdose County: Alameda
Age-Adjusted ED Visit Rate due to Heroin Overdose County: Alameda
3.1
Rate per 100,000 residents
(2022)
Compared to:
CA Counties
The distribution is based on data from 58 California counties.
CA Value
(3.6)
The regional value is compared to the California state value.
Prior Value
(1.4)
Prior Value compares a measured value with the previously measured value. Confidence intervals were not taken into account in determining the direction of the comparison.
Trend
This comparison measures the indicator’s values over multiple time periods.<br>The Mann-Kendall Test for Statistical Significance is used to evaluate the trend<br>over 4 to 10 periods of measure, subject to data availability and comparability.
Health / Alcohol & Drug Use
Age-Adjusted ED Visit Rate due to Opioid Overdose (excluding Heroin)
Value
Compared to:
Age-Adjusted ED Visit Rate due to Opioid Overdose (excluding Heroin) County: Alameda
Age-Adjusted ED Visit Rate due to Opioid Overdose (excluding Heroin) County: Alameda
30.1
Rate per 100,000 residents
(2022)
Compared to:
CA Counties
The distribution is based on data from 58 California counties.
CA Value
(54.9)
The regional value is compared to the California state value.
Prior Value
(5.9)
Prior Value compares a measured value with the previously measured value. Confidence intervals were not taken into account in determining the direction of the comparison.
Trend
This comparison measures the indicator’s values over multiple time periods.<br>The Mann-Kendall Test for Statistical Significance is used to evaluate the trend<br>over 4 to 10 periods of measure, subject to data availability and comparability.
Health / Alcohol & Drug Use
Age-Adjusted Hospitalization Rate due to All Drug Overdose
Value
Compared to:
Age-Adjusted Hospitalization Rate due to All Drug Overdose County: Alameda
Age-Adjusted Hospitalization Rate due to All Drug Overdose County: Alameda
39.1
Rate per 100,000 residents
(2022)
Compared to:
CA Counties
The distribution is based on data from 58 California counties.
CA Value
(48.3)
The regional value is compared to the California state value.
Prior Value
(36.2)
Prior Value compares a measured value with the previously measured value. Confidence intervals were not taken into account in determining the direction of the comparison.
Trend
This comparison measures the indicator’s values over multiple time periods.<br>The Mann-Kendall Test for Statistical Significance is used to evaluate the trend<br>over 4 to 10 periods of measure, subject to data availability and comparability.
Health / Alcohol & Drug Use
Age-Adjusted Hospitalization Rate due to Heroin Overdose
Value
Compared to:
Age-Adjusted Hospitalization Rate due to Heroin Overdose County: Alameda
Age-Adjusted Hospitalization Rate due to Heroin Overdose County: Alameda
1.1
Rate per 100,000 residents
(2022)
Compared to:
CA Counties
The distribution is based on data from 58 California counties.
CA Value
(0.7)
The regional value is compared to the California state value.
Prior Value
(1.4)
Prior Value compares a measured value with the previously measured value. Confidence intervals were not taken into account in determining the direction of the comparison.
Trend
This comparison measures the indicator’s values over multiple time periods.<br>The Mann-Kendall Test for Statistical Significance is used to evaluate the trend<br>over 4 to 10 periods of measure, subject to data availability and comparability.
Health / Alcohol & Drug Use
Age-Adjusted Hospitalization Rate due to Opioid Overdose (excluding Heroin)
Value
Compared to:
Age-Adjusted Hospitalization Rate due to Opioid Overdose (excluding Heroin) County: Alameda
Age-Adjusted Hospitalization Rate due to Opioid Overdose (excluding Heroin) County: Alameda
7.6
Rate per 100,000 residents
(2022)
Compared to:
CA Counties
The distribution is based on data from 58 California counties.
CA Value
(12.1)
The regional value is compared to the California state value.
Prior Value
(5.9)
Prior Value compares a measured value with the previously measured value. Confidence intervals were not taken into account in determining the direction of the comparison.
Trend
This comparison measures the indicator’s values over multiple time periods.<br>The Mann-Kendall Test for Statistical Significance is used to evaluate the trend<br>over 4 to 10 periods of measure, subject to data availability and comparability.
Health / Alcohol & Drug Use
Age-Adjusted Long Acting or Extended Release Opioid Prescription Rate to Opioid Naive Residents
Value
Compared to:
Age-Adjusted Long Acting or Extended Release Opioid Prescription Rate to Opioid Naive Residents County: Alameda
Age-Adjusted Long Acting or Extended Release Opioid Prescription Rate to Opioid Naive Residents County: Alameda
1.0
Per 100,000 population
(2022)
Compared to:
CA Counties
The distribution is based on data from 58 California counties.
CA Value
(1.2)
The regional value is compared to the California state value.
Prior Value
(1.3)
Prior Value compares a measured value with the previously measured value. Confidence intervals were taken into account in determining the direction of the comparison.
Trend
This comparison measures the indicator’s values over multiple time periods.<br>The Mann-Kendall Test for Statistical Significance is used to evaluate the trend<br>over 4 to 10 periods of measure, subject to data availability and comparability.
Opioid Prescription Patients County: Alameda
Opioid Prescription Patients County: Alameda
1.7%
(Q3 2022)
Compared to:
CA Counties
(Q2 2022)
The distribution is based on data from 58 California counties.
Prior Value
(1.7%)
Prior Value compares a measured value with the previously measured value. Confidence intervals were not taken into account in determining the direction of the comparison.
Trend
This comparison measures the indicator’s values over multiple time periods.<br>The Mann-Kendall Test for Statistical Significance is used to evaluate the trend<br>over 4 to 10 periods of measure, subject to data availability and comparability.
Quarterly Opioid Prescription Rate County: Alameda
Quarterly Opioid Prescription Rate County: Alameda
220.9
Prescriptions per 10,000 population
(Q3 2022)
Compared to:
CA Counties
(Q2 2022)
The distribution is based on data from 58 California counties.
Prior Value
(218.8)
Prior Value compares a measured value with the previously measured value. Confidence intervals were not taken into account in determining the direction of the comparison.
Trend
This comparison measures the indicator’s values over multiple time periods.<br>The Mann-Kendall Test for Statistical Significance is used to evaluate the trend<br>over 4 to 10 periods of measure, subject to data availability and comparability.
Health / Alcohol & Drug Use
Residents on More than 90 Morphine Milligram Equivalents (MME) of Opioids Daily
Value
Compared to:
Residents on More than 90 Morphine Milligram Equivalents (MME) of Opioids Daily County: Alameda
Residents on More than 90 Morphine Milligram Equivalents (MME) of Opioids Daily County: Alameda
5.0
Residents on >90 MMEs of Opioids per 1,000 residents
(2022)
Compared to:
CA Counties
The distribution is based on data from 58 California counties.
CA Value
(6.3)
The regional value is compared to the California state value.
Prior Value
(6.2)
Prior Value compares a measured value with the previously measured value. Confidence intervals were taken into account in determining the direction of the comparison.
Trend
This comparison measures the indicator’s values over multiple time periods.<br>The Mann-Kendall Test for Statistical Significance is used to evaluate the trend<br>over 4 to 10 periods of measure, subject to data availability and comparability.
Substance Use Emergency Department Visit Rate County: Alameda
Substance Use Emergency Department Visit Rate County: Alameda
1,537.2
Per 100,000 population
(2016-2018)
Compared to:
CA Value
(1,275.4 in 2012-2014)
The Alameda County value is compared to the 2013 CA State value.
Prior Value
(1,642.7)
Prior Value compares a measured value with the previously measured value. Confidence intervals were taken into account in determining the direction of the comparison.
Trend
This comparison measures the indicator’s values over multiple time periods.<br>The Mann-Kendall Test for Statistical Significance is used to evaluate the trend<br>over 4 to 10 periods of measure, subject to data availability and comparability.
Substance Use Emergency Department Visit Rate City/Place: Livermore
Substance Use Emergency Department Visit Rate City/Place: Livermore
933.7
Per 100,000 population
(2016-2018)
Compared to:
Alameda County Cities/Places
(2012-2014)
The distribution is based on data from Alameda County cities and census designated places. Alameda County cities and census designated places are approximated using zip codes.
Alameda, CA County Value
(1,537.2)
The regional value is compared to the Alameda County value.
CA Value
(1,275.4 in 2012-2014)
The Alameda County value is compared to the 2013 CA State value.
Prior Value
(927.0)
Prior Value compares a measured value with the previously measured value. Confidence intervals were taken into account in determining the direction of the comparison.
Trend
This comparison measures the indicator’s values over multiple time periods.<br>The Mann-Kendall Test for Statistical Significance is used to evaluate the trend<br>over 4 to 10 periods of measure, subject to data availability and comparability.
Economy / Employment
Unemployed Workers in Civilian Labor Force County: Alameda
Unemployed Workers in Civilian Labor Force County: Alameda
4.5%
(November 2023)
Compared to:
CA Counties
The distribution is based on data from 58 California counties.
U.S. Counties
The distribution is based on non-seasonally-adjusted data from 3,140 U.S. counties and county equivalents.
CA Value
(4.9%)
The regional value is compared to the California state value.
US Value
(3.5%)
The regional value is compared to the national value.
Prior Value
(4.4%)
Prior Value compares a measured value with the previously measured value. Confidence intervals were not taken into account in determining the direction of the comparison.
Trend
This comparison measures the indicator’s values over multiple time periods.<br>The Mann-Kendall Test for Statistical Significance is used to evaluate the trend<br>over 4 to 10 periods of measure, subject to data availability and comparability.
Unemployed Workers in Civilian Labor Force City/Place: Livermore
Unemployed Workers in Civilian Labor Force City/Place: Livermore
3.6%
(November 2023)
Compared to:
CA Value
(4.9%)
The regional value is compared to the California state value.
US Value
(3.5%)
The regional value is compared to the national value.
Prior Value
(3.6%)
Prior Value compares a measured value with the previously measured value. Confidence intervals were not taken into account in determining the direction of the comparison.
Trend
This comparison measures the indicator’s values over multiple time periods.<br>The Mann-Kendall Test for Statistical Significance is used to evaluate the trend<br>over 4 to 10 periods of measure, subject to data availability and comparability.
Economy / Housing & Homes
Economy / Housing & Homes
Renters Spending 30% or More of Household Income on Rent
Value
Compared to:
Renters Spending 30% or More of Household Income on Rent County: Alameda
Renters Spending 30% or More of Household Income on Rent County: Alameda
48.9%
(2018-2022)
Compared to:
CA Counties
The distribution is based on data from 58 California counties.
U.S. Counties
The distribution is based on data from 3,132 U.S. counties and county equivalents.
CA Value
(54.4%)
The regional value is compared to the California state value.
US Value
(49.9%)
The regional value is compared to the national value.
Trend
This comparison measures the indicator’s values over multiple time periods.<br>The Mann-Kendall Test for Statistical Significance is used to evaluate the trend<br>over 4 to 10 periods of measure, subject to data availability and comparability.
HP 2030 Target
(25.5%)
Renters Spending 30% or More of Household Income on Rent City/Place: Livermore
Renters Spending 30% or More of Household Income on Rent City/Place: Livermore
53.5%
(2018-2022)
Compared to:
CA Census Places
The distribution is based on data from 1,360 locales.
U.S. Census Places
The distribution is based on data from 26,241 U.S. Census Places.
Alameda, CA County Value
(48.9%)
The regional value is compared to the Alameda County value.
CA Value
(54.4%)
The regional value is compared to the California state value.
US Value
(49.9%)
The regional value is compared to the national value.
Trend
This comparison measures the indicator’s values over multiple time periods.<br>The Mann-Kendall Test for Statistical Significance is used to evaluate the trend<br>over 4 to 10 periods of measure, subject to data availability and comparability.
HP 2030 Target
(25.5%)
Severe Housing Problems County: Alameda
Severe Housing Problems County: Alameda
23.3%
(2016-2020)
Compared to:
CA Counties
The distribution is based on data from 58 California counties.
U.S. Counties
The distribution is based on data from 3,141 U.S. counties and county equivalents.
CA Value
(25.7%)
The regional value is compared to the California state value.
US Value
(16.7%)
The regional value is compared to the national value.
Prior Value
(23.3%)
Prior Value compares a measured value with the previously measured value. Confidence intervals were taken into account in determining the direction of the comparison.
Trend
This comparison measures the indicator’s values over multiple time periods.<br>The Mann-Kendall Test for Statistical Significance is used to evaluate the trend<br>over 4 to 10 periods of measure, subject to data availability and comparability.
Economy / Poverty
Children Living Below Poverty Level County: Alameda
Children Living Below Poverty Level County: Alameda
9.4%
(2018-2022)
Compared to:
CA Counties
The distribution is based on data from 58 California counties.
U.S. Counties
The distribution is based on data from 3,132 U.S. counties and county equivalents.
CA Value
(15.6%)
The regional value is compared to the California state value.
US Value
(16.7%)
The regional value is compared to the national value.
Trend
This comparison measures the indicator’s values over multiple time periods.<br>The Mann-Kendall Test for Statistical Significance is used to evaluate the trend<br>over 4 to 10 periods of measure, subject to data availability and comparability.
Children Living Below Poverty Level City/Place: Livermore
Children Living Below Poverty Level City/Place: Livermore
2.8%
(2018-2022)
Compared to:
CA Census Places
The distribution is based on data from 1,362 locales.
U.S. Census Places
The distribution is based on data from 27,556 U.S. Census Places.
Alameda, CA County Value
(9.4%)
The regional value is compared to the Alameda County value.
CA Value
(15.6%)
The regional value is compared to the California state value.
US Value
(16.7%)
The regional value is compared to the national value.
Trend
This comparison measures the indicator’s values over multiple time periods.<br>The Mann-Kendall Test for Statistical Significance is used to evaluate the trend<br>over 4 to 10 periods of measure, subject to data availability and comparability.
Families Living Below Poverty Level County: Alameda
Families Living Below Poverty Level County: Alameda
5.5%
(2018-2022)
Compared to:
CA Counties
The distribution is based on data from 58 California counties.
U.S. Counties
The distribution is based on data from 3,104 U.S. counties and county equivalents.
CA Value
(8.5%)
The regional value is compared to the California state value.
US Value
(8.8%)
The regional value is compared to the national value.
Trend
This comparison measures the indicator’s values over multiple time periods.<br>The Mann-Kendall Test for Statistical Significance is used to evaluate the trend<br>over 4 to 10 periods of measure, subject to data availability and comparability.
Families Living Below Poverty Level City/Place: Livermore
Families Living Below Poverty Level City/Place: Livermore
2.0%
(2018-2022)
Compared to:
CA Census Places
The distribution is based on data from 1,457 locales.
U.S. Census Places
The distribution is based on data from 28,635 U.S. Census Places.
Alameda, CA County Value
(5.5%)
The regional value is compared to the Alameda County value.
CA Value
(8.5%)
The regional value is compared to the California state value.
US Value
(8.8%)
The regional value is compared to the national value.
Trend
This comparison measures the indicator’s values over multiple time periods.<br>The Mann-Kendall Test for Statistical Significance is used to evaluate the trend<br>over 4 to 10 periods of measure, subject to data availability and comparability.
People Living 200% Above Poverty Level County: Alameda
People Living 200% Above Poverty Level County: Alameda
80.6%
(2018-2022)
Compared to:
CA Counties
The distribution is based on data from 58 California counties.
U.S. Counties
The distribution is based on data from 3,133 U.S. counties and county equivalents.
CA Value
(72.0%)
The regional value is compared to the California state value.
US Value
(71.2%)
The regional value is compared to the national value.
Trend
This comparison measures the indicator’s values over multiple time periods.<br>The Mann-Kendall Test for Statistical Significance is used to evaluate the trend<br>over 4 to 10 periods of measure, subject to data availability and comparability.
People Living 200% Above Poverty Level City/Place: Livermore
People Living 200% Above Poverty Level City/Place: Livermore
87.8%
(2018-2022)
Compared to:
CA Census Places
The distribution is based on data from 1,481 locales.
U.S. Census Places
The distribution is based on data from 28,869 U.S. Census Places.
Alameda, CA County Value
(80.6%)
The regional value is compared to the Alameda County value.
CA Value
(72.0%)
The regional value is compared to the California state value.
US Value
(71.2%)
The regional value is compared to the national value.
Trend
This comparison measures the indicator’s values over multiple time periods.<br>The Mann-Kendall Test for Statistical Significance is used to evaluate the trend<br>over 4 to 10 periods of measure, subject to data availability and comparability.
People Living Below Poverty Level County: Alameda
People Living Below Poverty Level County: Alameda
9.2%
(2018-2022)
Compared to:
CA Counties
The distribution is based on data from 58 California counties.
U.S. Counties
The distribution is based on data from 3,133 U.S. counties and county equivalents.
CA Value
(12.1%)
The regional value is compared to the California state value.
US Value
(12.5%)
The regional value is compared to the national value.
Trend
This comparison measures the indicator’s values over multiple time periods.<br>The Mann-Kendall Test for Statistical Significance is used to evaluate the trend<br>over 4 to 10 periods of measure, subject to data availability and comparability.
HP 2030 Target
(8.0%)
People Living Below Poverty Level City/Place: Livermore
People Living Below Poverty Level City/Place: Livermore
4.3%
(2018-2022)
Compared to:
CA Census Places
The distribution is based on data from 1,481 locales.
U.S. Census Places
The distribution is based on data from 28,869 U.S. Census Places.
Alameda, CA County Value
(9.2%)
The regional value is compared to the Alameda County value.
CA Value
(12.1%)
The regional value is compared to the California state value.
US Value
(12.5%)
The regional value is compared to the national value.
Trend
This comparison measures the indicator’s values over multiple time periods.<br>The Mann-Kendall Test for Statistical Significance is used to evaluate the trend<br>over 4 to 10 periods of measure, subject to data availability and comparability.
HP 2030 Target
(8.0%)
Youth not in School or Working County: Alameda
Youth not in School or Working County: Alameda
0.6%
(2018-2022)
Compared to:
CA Counties
The distribution is based on data from 58 California counties.
U.S. Counties
The distribution is based on data from 3,130 U.S. counties and county equivalents.
CA Value
(1.5%)
The regional value is compared to the California state value.
US Value
(1.8%)
The regional value is compared to the national value.
Trend
This comparison measures the indicator’s values over multiple time periods.<br>The Mann-Kendall Test for Statistical Significance is used to evaluate the trend<br>over 4 to 10 periods of measure, subject to data availability and comparability.
Youth not in School or Working City/Place: Livermore
Youth not in School or Working City/Place: Livermore
0.3%
(2018-2022)
Compared to:
CA Census Places
(2017-2021)
The distribution is based on data from 1,258 locales.
U.S. Census Places
(2015-2019)
The distribution is based on data from 26,145 U.S. Census Places.
Alameda, CA County Value
(0.6%)
The regional value is compared to the Alameda County value.
CA Value
(1.5%)
The regional value is compared to the California state value.
US Value
(1.8%)
The regional value is compared to the national value.
Trend
This comparison measures the indicator’s values over multiple time periods.<br>The Mann-Kendall Test for Statistical Significance is used to evaluate the trend<br>over 4 to 10 periods of measure, subject to data availability and comparability.
