
Advanced Search: Build a Custom Dashboard
In the fields below, search for indicators by location, topics, population, classification, subgroup, or comparison. No fields are required, but we suggest selecting a location or two to start. In the additional search options section, select options to group and order search results. To learn more about how to customize a dashboard, see our help center.
Visit the Indicator List Page to see the full list of indicators and locations available on the site.
Search Results:
Indicator Gauge Icon Legend
Legend Colors
Red is bad, green is good, blue is not statistically different/neutral.
Compared to Distribution
 the value is in the best half of communities.
 the value is in the 2nd worst quarter of communities.
 the value is in the worst quarter of communities.
Compared to Target
 meets target;
  does not meet target.
Compared to a Single Value
 lower than the comparison value;
 higher than the comparison value;
 not statistically different from comparison value.
Trend

 non-significant change over time;
 significant change over time;
  no change over time.
Compared to Prior Value
 higher than the previous measurement period;
 lower than the previous measurement period;
 no statistically different change from previous measurement period.
Health / Alcohol & Drug Use
Health / Alcohol & Drug Use
Census Tract: 06001436200 (Hayward Acres)
Value
Compared to:
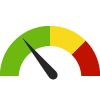
Census Tract: 06001436200 (Hayward Acres) Adults who Binge Drink: Last 30 Days
Census Tract: 06001436200 (Hayward Acres) Adults who Binge Drink: Last 30 Days
16.0%
(2021)
Compared to:

CA Census Tracts
The distribution is based on data from 8,005 California census tracts.
Alameda County Census Tracts
The distribution is based on data from 359 Alameda County Census Tracts.
U.S. Census Tracts
The distribution is based on data from 68,167 U.S. census tracts.
Alameda, CA County Value
(14.3%)
The regional value is compared to the Alameda County value.
US Value
(15.5%)
The regional value is compared to the national value.
Health / Cancer
Health / Cancer
Census Tract: 06001436200 (Hayward Acres)
Value
Compared to:
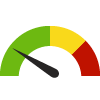
Census Tract: 06001436200 (Hayward Acres) Adults with Cancer
Census Tract: 06001436200 (Hayward Acres) Adults with Cancer
4.7%
(2021)
Compared to:
Alameda County Census Tracts
The distribution is based on data from 359 Alameda County Census Tracts.
CA Census Tracts
The distribution is based on data from 8,005 California census tracts.
U.S. Census Tracts
The distribution is based on data from 68,167 U.S. census tracts.
Alameda, CA County Value
(5.5%)
The regional value is compared to the Alameda County value.
US Value
(7.0%)
The regional value is compared to the national value.
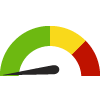
Census Tract: 06001436200 (Hayward Acres) Cervical Cancer Screening: 21-65
Census Tract: 06001436200 (Hayward Acres) Cervical Cancer Screening: 21-65
78.6%
(2020)
Compared to:

Alameda County Census Tracts
The distribution is based on data from 359 Alameda County Census Tracts.
CA Census Tracts
The distribution is based on data from 8,003 California census tracts.
U.S. Census Tracts
The distribution is based on data from 72,315 U.S. census tracts.
Alameda, CA County Value
(79.0%)
The regional value is compared to the Alameda County value.
US Value
(82.8%)
The regional value is compared to the national value.
Census Tract: 06001436200 (Hayward Acres) Colon Cancer Screening: Sigmoidoscopy Past 5 Years and FOBT Past 3 Years, Colonoscopy Past 10 Years, or FOBT Past Year
Census Tract: 06001436200 (Hayward Acres) Colon Cancer Screening: Sigmoidoscopy Past 5 Years and FOBT Past 3 Years, Colonoscopy Past 10 Years, or FOBT Past Year
59.7%
(2018)
Compared to:
CA Census Tracts
The distribution is based on data from 8,004 California census tracts.
Alameda County Census Tracts
The distribution is based on data from 359 Alameda County Census Tracts.
U.S. Census Tracts
The distribution is based on data from 72,298 U.S. census tracts.
Alameda, CA County Value
(67.7%)
The regional value is compared to the Alameda County value.
US Value
(66.4%)
The regional value is compared to the national value.
Census Tract: 06001436200 (Hayward Acres) Colon Cancer Screening: USPSTF Recommendation
Census Tract: 06001436200 (Hayward Acres) Colon Cancer Screening: USPSTF Recommendation
54.5%
(2020)
Compared to:
CA Census Tracts
The distribution is based on data from 8,004 California census tracts.
Alameda County Census Tracts
The distribution is based on data from 359 Alameda County Census Tracts.
U.S. Census Tracts
The distribution is based on data from 72,300 U.S. census tracts.
Alameda, CA County Value
(61.0%)
The regional value is compared to the Alameda County value.
US Value
(72.4%)
The regional value is compared to the national value.
Census Tract: 06001436200 (Hayward Acres) Mammogram in Past 2 Years: 50-74
Census Tract: 06001436200 (Hayward Acres) Mammogram in Past 2 Years: 50-74
73.3%
(2020)
Compared to:
Alameda County Census Tracts
The distribution is based on data from 359 Alameda County Census Tracts.
CA Census Tracts
The distribution is based on data from 7,996 California census tracts.
U.S. Census Tracts
The distribution is based on data from 72,248 U.S. census tracts.
Alameda, CA County Value
(71.6%)
The regional value is compared to the Alameda County value.
US Value
(78.2%)
The regional value is compared to the national value.
HP 2030 Target
(80.3%)
Census Tract: 06001436200 (Hayward Acres) Pap Test in Past 3 Years: 21-65
Census Tract: 06001436200 (Hayward Acres) Pap Test in Past 3 Years: 21-65
0.0%
(2014)
Compared to:
Alameda County Census Tracts
The distribution is based on data from 309 Alameda County Census Tracts.
US Value
(81.8%)
The regional value is compared to the national value.
Health / Diabetes
Health / Diabetes
Census Tract: 06001436200 (Hayward Acres)
Value
Compared to:
Census Tract: 06001436200 (Hayward Acres) Adults with Diabetes
Census Tract: 06001436200 (Hayward Acres) Adults with Diabetes
11.1%
(2021)
Compared to:
Alameda County Census Tracts
The distribution is based on data from 359 Alameda County Census Tracts.
CA Census Tracts
The distribution is based on data from 8,005 California census tracts.
U.S. Census Tracts
The distribution is based on data from 68,167 U.S. census tracts.
US Value
(11.3%)
The regional value is compared to the national value.
Health / Disabilities
Health / Disabilities
Census Tract: 06001436200 (Hayward Acres)
Value
Compared to:
Census Tract: 06001436200 (Hayward Acres) Adults with Disability Living in Poverty
Census Tract: 06001436200 (Hayward Acres) Adults with Disability Living in Poverty
27.2%
(2018-2022)
Compared to:

Alameda County Census Tracts
The distribution is based on data from 341 Alameda County Census Tracts.
CA Census Tracts
The distribution is based on data from 8,997 California census tracts.
U.S. Census Tracts
The distribution is based on data from 82,173 U.S. census tracts.
Alameda, CA County Value
(21.5%)
The regional value is compared to the Alameda County value.
Trend
This comparison measures the indicator’s values over multiple time periods.<br>The Mann-Kendall Test for Statistical Significance is used to evaluate the trend<br>over 4 to 10 periods of measure, subject to data availability and comparability.
Census Tract: 06001436200 (Hayward Acres) Children with a Disability
Census Tract: 06001436200 (Hayward Acres) Children with a Disability
7.2%
(2018-2022)
Compared to:


Alameda, CA County Value
(3.0%)
The regional value is compared to the Alameda County value.
Trend
This comparison measures the indicator’s values over multiple time periods.<br>The Mann-Kendall Test for Statistical Significance is used to evaluate the trend<br>over 4 to 10 periods of measure, subject to data availability and comparability.
Census Tract: 06001436200 (Hayward Acres) Persons with a Cognitive Difficulty
Census Tract: 06001436200 (Hayward Acres) Persons with a Cognitive Difficulty
4.5%
(2018-2022)
Compared to:
Alameda, CA County Value
(4.0%)
The regional value is compared to the Alameda County value.
Trend
This comparison measures the indicator’s values over multiple time periods.<br>The Mann-Kendall Test for Statistical Significance is used to evaluate the trend<br>over 4 to 10 periods of measure, subject to data availability and comparability.
Census Tract: 06001436200 (Hayward Acres) Persons with a Disability
Census Tract: 06001436200 (Hayward Acres) Persons with a Disability
11.2%
(2018-2022)
Compared to:
Alameda, CA County Value
(9.5%)
The regional value is compared to the Alameda County value.
Trend
This comparison measures the indicator’s values over multiple time periods.<br>The Mann-Kendall Test for Statistical Significance is used to evaluate the trend<br>over 4 to 10 periods of measure, subject to data availability and comparability.
Census Tract: 06001436200 (Hayward Acres) Persons with a Hearing Difficulty
Census Tract: 06001436200 (Hayward Acres) Persons with a Hearing Difficulty
0.7%
(2018-2022)
Compared to:


Alameda, CA County Value
(2.3%)
The regional value is compared to the Alameda County value.
Trend
This comparison measures the indicator’s values over multiple time periods.<br>The Mann-Kendall Test for Statistical Significance is used to evaluate the trend<br>over 4 to 10 periods of measure, subject to data availability and comparability.
Census Tract: 06001436200 (Hayward Acres) Persons with a Self-Care Difficulty
Census Tract: 06001436200 (Hayward Acres) Persons with a Self-Care Difficulty
4.2%
(2018-2022)
Compared to:

Alameda, CA County Value
(2.3%)
The regional value is compared to the Alameda County value.
Trend
This comparison measures the indicator’s values over multiple time periods.<br>The Mann-Kendall Test for Statistical Significance is used to evaluate the trend<br>over 4 to 10 periods of measure, subject to data availability and comparability.
Census Tract: 06001436200 (Hayward Acres) Persons with a Vision Difficulty
Census Tract: 06001436200 (Hayward Acres) Persons with a Vision Difficulty
3.5%
(2018-2022)
Compared to:
Alameda, CA County Value
(1.8%)
The regional value is compared to the Alameda County value.
Trend
This comparison measures the indicator’s values over multiple time periods.<br>The Mann-Kendall Test for Statistical Significance is used to evaluate the trend<br>over 4 to 10 periods of measure, subject to data availability and comparability.
Census Tract: 06001436200 (Hayward Acres) Persons with an Ambulatory Difficulty
Census Tract: 06001436200 (Hayward Acres) Persons with an Ambulatory Difficulty
5.4%
(2018-2022)
Compared to:
Alameda, CA County Value
(4.9%)
The regional value is compared to the Alameda County value.
Trend
This comparison measures the indicator’s values over multiple time periods.<br>The Mann-Kendall Test for Statistical Significance is used to evaluate the trend<br>over 4 to 10 periods of measure, subject to data availability and comparability.
Health / Health Care Access & Quality
Health / Health Care Access & Quality
Census Tract: 06001436200 (Hayward Acres)
Value
Compared to:
Census Tract: 06001436200 (Hayward Acres) Adults who have had a Routine Checkup
Census Tract: 06001436200 (Hayward Acres) Adults who have had a Routine Checkup
57.9%
(2021)
Compared to:
Alameda County Census Tracts
The distribution is based on data from 359 Alameda County Census Tracts.
CA Census Tracts
The distribution is based on data from 8,005 California census tracts.
U.S. Census Tracts
The distribution is based on data from 68,167 U.S. census tracts.
Alameda, CA County Value
(61.1%)
The regional value is compared to the Alameda County value.
US Value
(73.6%)
The regional value is compared to the national value.
Census Tract: 06001436200 (Hayward Acres) Adults without Health Insurance
Census Tract: 06001436200 (Hayward Acres) Adults without Health Insurance
16.5%
(2021)
Compared to:
CA Census Tracts
The distribution is based on data from 8,005 California census tracts.
Alameda County Census Tracts
The distribution is based on data from 359 Alameda County Census Tracts.
U.S. Census Tracts
The distribution is based on data from 68,167 U.S. census tracts.
Alameda, CA County Value
(7.2%)
The regional value is compared to the Alameda County value.
US Value
(10.8%)
The regional value is compared to the national value.
Health / Health Information Technology
Health / Health Information Technology
Census Tract: 06001436200 (Hayward Acres)
Value
Compared to:
Census Tract: 06001436200 (Hayward Acres) Households with an Internet Subscription
Census Tract: 06001436200 (Hayward Acres) Households with an Internet Subscription
85.8%
(2018-2022)
Compared to:
CA Census Tracts
The distribution is based on data from 9,039 California census tracts.
Alameda County Census Tracts
The distribution is based on data from 342 Alameda County Census Tracts.
U.S. Census Tracts
The distribution is based on data from 82,467 U.S. census tracts.
Alameda, CA County Value
(93.0%)
The regional value is compared to the Alameda County value.
Trend
This comparison measures the indicator’s values over multiple time periods.<br>The Mann-Kendall Test for Statistical Significance is used to evaluate the trend<br>over 4 to 10 periods of measure, subject to data availability and comparability.
Census Tract: 06001436200 (Hayward Acres) Households with One or More Types of Computing Devices
Census Tract: 06001436200 (Hayward Acres) Households with One or More Types of Computing Devices
93.9%
(2018-2022)
Compared to:
Alameda County Census Tracts
The distribution is based on data from 342 Alameda County Census Tracts.
CA Census Tracts
The distribution is based on data from 9,039 California census tracts.
U.S. Census Tracts
The distribution is based on data from 82,477 U.S. census tracts.
Alameda, CA County Value
(96.4%)
The regional value is compared to the Alameda County value.
Trend
This comparison measures the indicator’s values over multiple time periods.<br>The Mann-Kendall Test for Statistical Significance is used to evaluate the trend<br>over 4 to 10 periods of measure, subject to data availability and comparability.
Census Tract: 06001436200 (Hayward Acres) Persons with an Internet Subscription
Census Tract: 06001436200 (Hayward Acres) Persons with an Internet Subscription
89.3%
(2018-2022)
Compared to:
CA Census Tracts
The distribution is based on data from 9,042 California census tracts.
Alameda County Census Tracts
The distribution is based on data from 342 Alameda County Census Tracts.
U.S. Census Tracts
The distribution is based on data from 82,486 U.S. census tracts.
Alameda, CA County Value
(94.6%)
The regional value is compared to the Alameda County value.
Trend
This comparison measures the indicator’s values over multiple time periods.<br>The Mann-Kendall Test for Statistical Significance is used to evaluate the trend<br>over 4 to 10 periods of measure, subject to data availability and comparability.
Health / Heart Disease & Stroke
Health / Heart Disease & Stroke
Census Tract: 06001436200 (Hayward Acres)
Value
Compared to:
Census Tract: 06001436200 (Hayward Acres) Adults who Experienced a Stroke
Census Tract: 06001436200 (Hayward Acres) Adults who Experienced a Stroke
3.1%
(2021)
Compared to:
CA Census Tracts
The distribution is based on data from 8,005 California census tracts.
Alameda County Census Tracts
The distribution is based on data from 359 Alameda County Census Tracts.
U.S. Census Tracts
The distribution is based on data from 68,167 U.S. census tracts.
Alameda, CA County Value
(2.5%)
The regional value is compared to the Alameda County value.
US Value
(3.3%)
The regional value is compared to the national value.
Census Tract: 06001436200 (Hayward Acres) Adults who Experienced Coronary Heart Disease
Census Tract: 06001436200 (Hayward Acres) Adults who Experienced Coronary Heart Disease
4.8%
(2021)
Compared to:
CA Census Tracts
The distribution is based on data from 8,005 California census tracts.
Alameda County Census Tracts
The distribution is based on data from 359 Alameda County Census Tracts.
U.S. Census Tracts
The distribution is based on data from 68,167 U.S. census tracts.
Alameda, CA County Value
(4.4%)
The regional value is compared to the Alameda County value.
US Value
(6.1%)
The regional value is compared to the national value.
Census Tract: 06001436200 (Hayward Acres) Adults who Have Taken Medications for High Blood Pressure
Census Tract: 06001436200 (Hayward Acres) Adults who Have Taken Medications for High Blood Pressure
68.0%
(2021)
Compared to:
CA Census Tracts
The distribution is based on data from 8,005 California census tracts.
Alameda County Census Tracts
The distribution is based on data from 359 Alameda County Census Tracts.
U.S. Census Tracts
The distribution is based on data from 68,167 U.S. census tracts.
Alameda, CA County Value
(72.1%)
The regional value is compared to the Alameda County value.
US Value
(78.2%)
The regional value is compared to the national value.
Census Tract: 06001436200 (Hayward Acres) Cholesterol Test History
Census Tract: 06001436200 (Hayward Acres) Cholesterol Test History
79.9%
(2021)
Compared to:
Alameda County Census Tracts
The distribution is based on data from 359 Alameda County Census Tracts.
CA Census Tracts
The distribution is based on data from 8,005 California census tracts.
U.S. Census Tracts
The distribution is based on data from 68,167 U.S. census tracts.
Alameda, CA County Value
(85.6%)
The regional value is compared to the Alameda County value.
US Value
(86.4%)
The regional value is compared to the national value.
Census Tract: 06001436200 (Hayward Acres) High Blood Pressure Prevalence
Census Tract: 06001436200 (Hayward Acres) High Blood Pressure Prevalence
27.8%
(2021)
Compared to:
CA Census Tracts
The distribution is based on data from 8,005 California census tracts.
Alameda County Census Tracts
The distribution is based on data from 359 Alameda County Census Tracts.
U.S. Census Tracts
The distribution is based on data from 68,167 U.S. census tracts.
Alameda, CA County Value
(26.9%)
The regional value is compared to the Alameda County value.
US Value
(32.7%)
The regional value is compared to the national value.
HP 2030 Target
(41.9%)
Census Tract: 06001436200 (Hayward Acres) High Cholesterol Prevalence: Past 5 Years
Census Tract: 06001436200 (Hayward Acres) High Cholesterol Prevalence: Past 5 Years
31.9%
(2021)
Compared to:
CA Census Tracts
The distribution is based on data from 8,005 California census tracts.
Alameda County Census Tracts
The distribution is based on data from 359 Alameda County Census Tracts.
U.S. Census Tracts
The distribution is based on data from 68,167 U.S. census tracts.
Alameda, CA County Value
(34.1%)
The regional value is compared to the Alameda County value.
US Value
(36.4%)
The regional value is compared to the national value.
Health / Mental Health & Mental Disorders
Health / Mental Health & Mental Disorders
Census Tract: 06001436200 (Hayward Acres)
Value
Compared to:
Census Tract: 06001436200 (Hayward Acres) Adults Ever Diagnosed with Depression
Census Tract: 06001436200 (Hayward Acres) Adults Ever Diagnosed with Depression
19.3%
(2021)
Compared to:
Alameda County Census Tracts
The distribution is based on data from 359 Alameda County Census Tracts.
CA Census Tracts
The distribution is based on data from 8,005 California census tracts.
U.S. Census Tracts
The distribution is based on data from 68,167 U.S. census tracts.
Alameda, CA County Value
(15.9%)
The regional value is compared to the Alameda County value.
US Value
(19.5%)
The regional value is compared to the national value.
Census Tract: 06001436200 (Hayward Acres) Poor Mental Health: 14+ Days
Census Tract: 06001436200 (Hayward Acres) Poor Mental Health: 14+ Days
18.3%
(2021)
Compared to:
CA Census Tracts
The distribution is based on data from 8,005 California census tracts.
Alameda County Census Tracts
The distribution is based on data from 359 Alameda County Census Tracts.
U.S. Census Tracts
The distribution is based on data from 68,167 U.S. census tracts.
Alameda, CA County Value
(13.5%)
The regional value is compared to the Alameda County value.
US Value
(14.7%)
The regional value is compared to the national value.
Health / Mortality Data
Health / Mortality Data
Census Tract: 06001436200 (Hayward Acres)
Value
Compared to:
Census Tract: 06001436200 (Hayward Acres) Life Expectancy
Census Tract: 06001436200 (Hayward Acres) Life Expectancy
75.6
Years
(2010-2015)
Compared to:
Alameda County Census Tracts
The distribution is based on data from 338 Alameda County Census Tracts.
CA Census Tracts
The distribution is based on data from 7,516 California census tracts.
U.S. Census Tracts
The distribution is based on data from 65,662 U.S. census tracts.
Health / Older Adults
Health / Older Adults
Census Tract: 06001436200 (Hayward Acres)
Value
Compared to:
Census Tract: 06001436200 (Hayward Acres) Adults 65+ who Received Recommended Preventive Services: Females
Census Tract: 06001436200 (Hayward Acres) Adults 65+ who Received Recommended Preventive Services: Females
22.8%
(2020)
Compared to:
CA Census Tracts
The distribution is based on data from 7,980 California census tracts.
Alameda County Census Tracts
The distribution is based on data from 359 Alameda County Census Tracts.
U.S. Census Tracts
The distribution is based on data from 72,137 U.S. census tracts.
Alameda, CA County Value
(30.9%)
The regional value is compared to the Alameda County value.
US Value
(37.9%)
The regional value is compared to the national value.
Census Tract: 06001436200 (Hayward Acres) Adults 65+ who Received Recommended Preventive Services: Males
Census Tract: 06001436200 (Hayward Acres) Adults 65+ who Received Recommended Preventive Services: Males
30.6%
(2020)
Compared to:
CA Census Tracts
The distribution is based on data from 7,994 California census tracts.
Alameda County Census Tracts
The distribution is based on data from 358 Alameda County Census Tracts.
U.S. Census Tracts
The distribution is based on data from 72,188 U.S. census tracts.
Alameda, CA County Value
(38.2%)
The regional value is compared to the Alameda County value.
US Value
(43.7%)
The regional value is compared to the national value.
Census Tract: 06001436200 (Hayward Acres) Adults 65+ with a Disability
Census Tract: 06001436200 (Hayward Acres) Adults 65+ with a Disability
21.3%
(2018-2022)
Compared to:
Alameda, CA County Value
(30.8%)
The regional value is compared to the Alameda County value.
Trend
This comparison measures the indicator’s values over multiple time periods.<br>The Mann-Kendall Test for Statistical Significance is used to evaluate the trend<br>over 4 to 10 periods of measure, subject to data availability and comparability.
Census Tract: 06001436200 (Hayward Acres) Adults 65+ with a Hearing Difficulty
Census Tract: 06001436200 (Hayward Acres) Adults 65+ with a Hearing Difficulty
0.0%
(2018-2022)
Compared to:
Alameda, CA County Value
(11.1%)
The regional value is compared to the Alameda County value.
Trend
This comparison measures the indicator’s values over multiple time periods.<br>The Mann-Kendall Test for Statistical Significance is used to evaluate the trend<br>over 4 to 10 periods of measure, subject to data availability and comparability.
Census Tract: 06001436200 (Hayward Acres) Adults 65+ with a Self-Care Difficulty
Census Tract: 06001436200 (Hayward Acres) Adults 65+ with a Self-Care Difficulty
8.6%
(2018-2022)
Compared to:
Alameda, CA County Value
(8.7%)
The regional value is compared to the Alameda County value.
Trend
This comparison measures the indicator’s values over multiple time periods.<br>The Mann-Kendall Test for Statistical Significance is used to evaluate the trend<br>over 4 to 10 periods of measure, subject to data availability and comparability.
Census Tract: 06001436200 (Hayward Acres) Adults 65+ with a Vision Difficulty
Census Tract: 06001436200 (Hayward Acres) Adults 65+ with a Vision Difficulty
1.6%
(2018-2022)
Compared to:
Alameda, CA County Value
(5.5%)
The regional value is compared to the Alameda County value.
Trend
This comparison measures the indicator’s values over multiple time periods.<br>The Mann-Kendall Test for Statistical Significance is used to evaluate the trend<br>over 4 to 10 periods of measure, subject to data availability and comparability.
Census Tract: 06001436200 (Hayward Acres) Adults 65+ with an Independent Living Difficulty
Census Tract: 06001436200 (Hayward Acres) Adults 65+ with an Independent Living Difficulty
10.0%
(2018-2022)
Compared to:

Alameda, CA County Value
(16.1%)
The regional value is compared to the Alameda County value.
Trend
This comparison measures the indicator’s values over multiple time periods.<br>The Mann-Kendall Test for Statistical Significance is used to evaluate the trend<br>over 4 to 10 periods of measure, subject to data availability and comparability.
Health / Oral Health
Health / Oral Health
Census Tract: 06001436200 (Hayward Acres)
Value
Compared to:
Census Tract: 06001436200 (Hayward Acres) Adults 65+ with Total Tooth Loss
Census Tract: 06001436200 (Hayward Acres) Adults 65+ with Total Tooth Loss
16.7%
(2020)
Compared to:
CA Census Tracts
The distribution is based on data from 7,998 California census tracts.
Alameda County Census Tracts
The distribution is based on data from 359 Alameda County Census Tracts.
U.S. Census Tracts
The distribution is based on data from 72,233 U.S. census tracts.
Alameda, CA County Value
(6.7%)
The regional value is compared to the Alameda County value.
US Value
(13.4%)
The regional value is compared to the national value.
Census Tract: 06001436200 (Hayward Acres) Adults who Visited a Dentist
Census Tract: 06001436200 (Hayward Acres) Adults who Visited a Dentist
50.7%
(2020)
Compared to:
CA Census Tracts
The distribution is based on data from 8,005 California census tracts.
Alameda County Census Tracts
The distribution is based on data from 359 Alameda County Census Tracts.
U.S. Census Tracts
The distribution is based on data from 72,332 U.S. census tracts.
Alameda, CA County Value
(63.1%)
The regional value is compared to the Alameda County value.
US Value
(64.8%)
The regional value is compared to the national value.
Health / Other Conditions
Health / Other Conditions
Census Tract: 06001436200 (Hayward Acres)
Value
Compared to:
Census Tract: 06001436200 (Hayward Acres) Adults with Arthritis
Census Tract: 06001436200 (Hayward Acres) Adults with Arthritis
18.3%
(2021)
Compared to:
Alameda County Census Tracts
The distribution is based on data from 359 Alameda County Census Tracts.
CA Census Tracts
The distribution is based on data from 8,005 California census tracts.
U.S. Census Tracts
The distribution is based on data from 68,167 U.S. census tracts.
Alameda, CA County Value
(17.8%)
The regional value is compared to the Alameda County value.
US Value
(25.2%)
The regional value is compared to the national value.
Census Tract: 06001436200 (Hayward Acres) Adults with Kidney Disease
Census Tract: 06001436200 (Hayward Acres) Adults with Kidney Disease
3.0%
(2021)
Compared to:
Alameda County Census Tracts
The distribution is based on data from 359 Alameda County Census Tracts.
CA Census Tracts
The distribution is based on data from 8,005 California census tracts.
U.S. Census Tracts
The distribution is based on data from 68,167 U.S. census tracts.
Alameda, CA County Value
(2.7%)
The regional value is compared to the Alameda County value.
US Value
(3.1%)
The regional value is compared to the national value.
Health / Physical Activity
Health / Physical Activity
Census Tract: 06001436200 (Hayward Acres)
Value
Compared to:
Census Tract: 06001436200 (Hayward Acres) Adults who are Sedentary
Census Tract: 06001436200 (Hayward Acres) Adults who are Sedentary
26.3%
(2021)
Compared to:
Alameda County Census Tracts
The distribution is based on data from 359 Alameda County Census Tracts.
CA Census Tracts
The distribution is based on data from 8,005 California census tracts.
U.S. Census Tracts
The distribution is based on data from 68,167 U.S. census tracts.
US Value
(23.7%)
The regional value is compared to the national value.
HP 2030 Target
(21.8%)
Health / Respiratory Diseases
Health / Respiratory Diseases
Census Tract: 06001436200 (Hayward Acres)
Value
Compared to:
Census Tract: 06001436200 (Hayward Acres) Adults with COPD
Census Tract: 06001436200 (Hayward Acres) Adults with COPD
5.6%
Percent of adults
(2021)
Compared to:
Alameda County Census Tracts
The distribution is based on data from 359 Alameda County Census Tracts.
CA Census Tracts
The distribution is based on data from 8,005 California census tracts.
U.S. Census Tracts
The distribution is based on data from 68,167 U.S. census tracts.
Alameda, CA County Value
(4.0%)
The regional value is compared to the Alameda County value.
US Value
(6.4%)
The regional value is compared to the national value.
Census Tract: 06001436200 (Hayward Acres) Adults with Current Asthma
Census Tract: 06001436200 (Hayward Acres) Adults with Current Asthma
10.4%
(2021)
Compared to:
Alameda County Census Tracts
The distribution is based on data from 359 Alameda County Census Tracts.
CA Census Tracts
The distribution is based on data from 8,005 California census tracts.
U.S. Census Tracts
The distribution is based on data from 68,167 U.S. census tracts.
Alameda, CA County Value
(8.6%)
The regional value is compared to the Alameda County value.
US Value
(9.7%)
The regional value is compared to the national value.
Health / Tobacco Use
Health / Tobacco Use
Census Tract: 06001436200 (Hayward Acres)
Value
Compared to:
Census Tract: 06001436200 (Hayward Acres) Adults who Smoke
Census Tract: 06001436200 (Hayward Acres) Adults who Smoke
14.7%
(2021)
Compared to:
CA Census Tracts
The distribution is based on data from 8,005 California census tracts.
Alameda County Census Tracts
The distribution is based on data from 359 Alameda County Census Tracts.
U.S. Census Tracts
The distribution is based on data from 68,167 U.S. census tracts.
Alameda, CA County Value
(9.4%)
The regional value is compared to the Alameda County value.
US Value
(13.5%)
The regional value is compared to the national value.
HP 2030 Target
(6.1%)
<div>TU-02: Reduce current cigarette smoking in adults <strong>(LEADING HEALTH INDICATOR)</strong></div>
Health / Weight Status
Health / Weight Status
Census Tract: 06001436200 (Hayward Acres)
Value
Compared to:
Census Tract: 06001436200 (Hayward Acres) Adults Who Are Obese
Census Tract: 06001436200 (Hayward Acres) Adults Who Are Obese
33.8%
(2021)
Compared to:
CA Census Tracts
The distribution is based on data from 8,005 California census tracts.
Alameda County Census Tracts
The distribution is based on data from 359 Alameda County Census Tracts.
U.S. Census Tracts
The distribution is based on data from 68,167 U.S. census tracts.
US Value
(33.0%)
The regional value is compared to the national value.
Health / Wellness & Lifestyle
Health / Wellness & Lifestyle
Census Tract: 06001436200 (Hayward Acres)
Value
Compared to:
Census Tract: 06001436200 (Hayward Acres) Insufficient Sleep
Census Tract: 06001436200 (Hayward Acres) Insufficient Sleep
33.2%
(2020)
Compared to:
Alameda County Census Tracts
The distribution is based on data from 359 Alameda County Census Tracts.
CA Census Tracts
The distribution is based on data from 8,005 California census tracts.
U.S. Census Tracts
The distribution is based on data from 72,332 U.S. census tracts.
Alameda, CA County Value
(29.9%)
The regional value is compared to the Alameda County value.
US Value
(32.7%)
The regional value is compared to the national value.
HP 2030 Target
(26.7%)
Census Tract: 06001436200 (Hayward Acres) Life Expectancy
Census Tract: 06001436200 (Hayward Acres) Life Expectancy
74.1
Years
(2011-2015)
Compared to:
Alameda County Census Tracts
The distribution is based on data from 356 Alameda County Census Tracts.
Alameda, CA County Value
(82.0)
The regional value is compared to the Alameda County value.
Census Tract: 06001436200 (Hayward Acres) Poor Physical Health: 14+ Days
Census Tract: 06001436200 (Hayward Acres) Poor Physical Health: 14+ Days
12.7%
(2021)
Compared to:
Alameda County Census Tracts
The distribution is based on data from 359 Alameda County Census Tracts.
CA Census Tracts
The distribution is based on data from 8,005 California census tracts.
U.S. Census Tracts
The distribution is based on data from 68,167 U.S. census tracts.
Alameda, CA County Value
(9.0%)
The regional value is compared to the Alameda County value.
US Value
(10.9%)
The regional value is compared to the national value.
Census Tract: 06001436200 (Hayward Acres) Self-Reported General Health Assessment: Poor or Fair
Census Tract: 06001436200 (Hayward Acres) Self-Reported General Health Assessment: Poor or Fair
20.9%
(2021)
Compared to:
CA Census Tracts
The distribution is based on data from 8,005 California census tracts.
Alameda County Census Tracts
The distribution is based on data from 359 Alameda County Census Tracts.
U.S. Census Tracts
The distribution is based on data from 68,167 U.S. census tracts.
Alameda, CA County Value
(13.3%)
The regional value is compared to the Alameda County value.
US Value
(16.1%)
The regional value is compared to the national value.
Community / Demographics
Community / Demographics
Census Tract: 06001436200 (Hayward Acres)
Value
Compared to:
Census Tract: 06001436200 (Hayward Acres) Average Household Size
Census Tract: 06001436200 (Hayward Acres) Average Household Size
3.10
Persons per household
(2018-2022)
Compared to:
Alameda, CA County Value
(2.80)
The regional value is compared to the Alameda County value.
Trend
This comparison measures the indicator’s values over multiple time periods.<br>The Mann-Kendall Test for Statistical Significance is used to evaluate the trend<br>over 4 to 10 periods of measure, subject to data availability and comparability.
Census Tract: 06001436200 (Hayward Acres) Foreign Born Persons
Census Tract: 06001436200 (Hayward Acres) Foreign Born Persons
33.5%
(2018-2022)
Compared to:
Alameda, CA County Value
(33.3%)
The regional value is compared to the Alameda County value.
Census Tract: 06001436200 (Hayward Acres) Population Over Age 65 (Count)
Census Tract: 06001436200 (Hayward Acres) Population Over Age 65 (Count)
607
People
(2018-2022)
Compared to:
Trend
This comparison measures the indicator’s values over multiple time periods.<br>The Mann-Kendall Test for Statistical Significance is used to evaluate the trend<br>over 4 to 10 periods of measure, subject to data availability and comparability.
Census Tract: 06001436200 (Hayward Acres) Veteran Population
Census Tract: 06001436200 (Hayward Acres) Veteran Population
3.0%
(2018-2022)
Compared to:
Alameda, CA County Value
(3.4%)
The regional value is compared to the Alameda County value.
Trend
This comparison measures the indicator’s values over multiple time periods.<br>The Mann-Kendall Test for Statistical Significance is used to evaluate the trend<br>over 4 to 10 periods of measure, subject to data availability and comparability.
Community / Social Environment
Community / Social Environment
Census Tract: 06001436200 (Hayward Acres)
Value
Compared to:
Census Tract: 06001436200 (Hayward Acres) Children in Single-Parent Households
Census Tract: 06001436200 (Hayward Acres) Children in Single-Parent Households
14.9%
(2018-2022)
Compared to:
Alameda County Census Tracts
The distribution is based on data from 339 Alameda County Census Tracts.
CA Census Tracts
The distribution is based on data from 8,999 California census tracts.
U.S. Census Tracts
The distribution is based on data from 82,073 U.S. census tracts.
Alameda, CA County Value
(19.0%)
The regional value is compared to the Alameda County value.
Trend
This comparison measures the indicator’s values over multiple time periods.<br>The Mann-Kendall Test for Statistical Significance is used to evaluate the trend<br>over 4 to 10 periods of measure, subject to data availability and comparability.
Census Tract: 06001436200 (Hayward Acres) People 65+ Living Alone
Census Tract: 06001436200 (Hayward Acres) People 65+ Living Alone
25.7%
(2018-2022)
Compared to:

CA Census Tracts
The distribution is based on data from 9,042 California census tracts.
Alameda County Census Tracts
The distribution is based on data from 341 Alameda County Census Tracts.
U.S. Census Tracts
The distribution is based on data from 82,349 U.S. census tracts.
Alameda, CA County Value
(22.6%)
The regional value is compared to the Alameda County value.
Trend
This comparison measures the indicator’s values over multiple time periods.<br>The Mann-Kendall Test for Statistical Significance is used to evaluate the trend<br>over 4 to 10 periods of measure, subject to data availability and comparability.
Census Tract: 06001436200 (Hayward Acres) People 65+ Living Alone (Count)
Census Tract: 06001436200 (Hayward Acres) People 65+ Living Alone (Count)
156
People
(2018-2022)
Compared to:
Trend
This comparison measures the indicator’s values over multiple time periods.<br>The Mann-Kendall Test for Statistical Significance is used to evaluate the trend<br>over 4 to 10 periods of measure, subject to data availability and comparability.
Community / Transportation
Community / Transportation
Census Tract: 06001436200 (Hayward Acres)
Value
Compared to:
Census Tract: 06001436200 (Hayward Acres) Mean Travel Time to Work
Census Tract: 06001436200 (Hayward Acres) Mean Travel Time to Work
32.7
Minutes
(2018-2022)
Compared to:
Alameda County Census Tracts
The distribution is based on data from 340 Alameda County Census Tracts.
CA Census Tracts
The distribution is based on data from 9,027 California census tracts.
U.S. Census Tracts
The distribution is based on data from 82,376 U.S. census tracts.
Alameda, CA County Value
(32.6)
The regional value is compared to the Alameda County value.
Trend
This comparison measures the indicator’s values over multiple time periods.<br>The Mann-Kendall Test for Statistical Significance is used to evaluate the trend<br>over 4 to 10 periods of measure, subject to data availability and comparability.
Census Tract: 06001436200 (Hayward Acres) Workers Commuting by Public Transportation
Census Tract: 06001436200 (Hayward Acres) Workers Commuting by Public Transportation
4.3%
(2018-2022)
Compared to:

Alameda County Census Tracts
The distribution is based on data from 342 Alameda County Census Tracts.
CA Census Tracts
(2017-2021)
The distribution is based on data from 9,058 California census tracts.
Alameda, CA County Value
(10.6%)
The regional value is compared to the Alameda County value.
Trend
This comparison measures the indicator’s values over multiple time periods.<br>The Mann-Kendall Test for Statistical Significance is used to evaluate the trend<br>over 4 to 10 periods of measure, subject to data availability and comparability.
HP 2030 Target
(5.3%)
Census Tract: 06001436200 (Hayward Acres) Workers who Drive Alone to Work
Census Tract: 06001436200 (Hayward Acres) Workers who Drive Alone to Work
72.5%
(2018-2022)
Compared to:
CA Census Tracts
The distribution is based on data from 9,056 California census tracts.
Alameda County Census Tracts
The distribution is based on data from 342 Alameda County Census Tracts.
U.S. Census Tracts
The distribution is based on data from 82,602 U.S. census tracts.
Alameda, CA County Value
(54.7%)
The regional value is compared to the Alameda County value.
Trend
This comparison measures the indicator’s values over multiple time periods.<br>The Mann-Kendall Test for Statistical Significance is used to evaluate the trend<br>over 4 to 10 periods of measure, subject to data availability and comparability.
Census Tract: 06001436200 (Hayward Acres) Workers who Walk to Work
Census Tract: 06001436200 (Hayward Acres) Workers who Walk to Work
5.5%
(2018-2022)
Compared to:
Alameda County Census Tracts
The distribution is based on data from 342 Alameda County Census Tracts.
CA Census Tracts
(2015-2019)
The distribution is based on data from 7,992 California census tracts.
U.S. Census Tracts
(2015-2019)
The distribution is based on data from 72,298 U.S. census tracts.
Alameda, CA County Value
(2.8%)
The regional value is compared to the Alameda County value.
Trend
This comparison measures the indicator’s values over multiple time periods.<br>The Mann-Kendall Test for Statistical Significance is used to evaluate the trend<br>over 4 to 10 periods of measure, subject to data availability and comparability.
Economy / Employment
Economy / Employment
Census Tract: 06001436200 (Hayward Acres)
Value
Compared to:
Census Tract: 06001436200 (Hayward Acres) Female Population 16+ in Civilian Labor Force
Census Tract: 06001436200 (Hayward Acres) Female Population 16+ in Civilian Labor Force
54.3%
(2018-2022)
Compared to:
Alameda County Census Tracts
The distribution is based on data from 342 Alameda County Census Tracts.
CA Census Tracts
The distribution is based on data from 9,066 California census tracts.
U.S. Census Tracts
The distribution is based on data from 82,647 U.S. census tracts.
Alameda, CA County Value
(61.3%)
The regional value is compared to the Alameda County value.
Trend
This comparison measures the indicator’s values over multiple time periods.<br>The Mann-Kendall Test for Statistical Significance is used to evaluate the trend<br>over 4 to 10 periods of measure, subject to data availability and comparability.
Census Tract: 06001436200 (Hayward Acres) Population 16+ in Civilian Labor Force
Census Tract: 06001436200 (Hayward Acres) Population 16+ in Civilian Labor Force
67.3%
(2018-2022)
Compared to:
Alameda County Census Tracts
The distribution is based on data from 342 Alameda County Census Tracts.
CA Census Tracts
The distribution is based on data from 9,080 California census tracts.
U.S. Census Tracts
The distribution is based on data from 82,741 U.S. census tracts.
Alameda, CA County Value
(63.6%)
The regional value is compared to the Alameda County value.
Trend
This comparison measures the indicator’s values over multiple time periods.<br>The Mann-Kendall Test for Statistical Significance is used to evaluate the trend<br>over 4 to 10 periods of measure, subject to data availability and comparability.
Economy / Food Insecurity
Economy / Food Insecurity
Census Tract: 06001436200 (Hayward Acres)
Value
Compared to:
Census Tract: 06001436200 (Hayward Acres) Households Receiving SNAP with Children
Census Tract: 06001436200 (Hayward Acres) Households Receiving SNAP with Children
56.4%
(2018-2022)
Compared to:
Alameda, CA County Value
(43.2%)
The regional value is compared to the Alameda County value.
Trend
This comparison measures the indicator’s values over multiple time periods.<br>The Mann-Kendall Test for Statistical Significance is used to evaluate the trend<br>over 4 to 10 periods of measure, subject to data availability and comparability.
Census Tract: 06001436200 (Hayward Acres) Households Receiving SNAP with Children (Count)
Census Tract: 06001436200 (Hayward Acres) Households Receiving SNAP with Children (Count)
53
Households
(2018-2022)
Compared to:
Trend
This comparison measures the indicator’s values over multiple time periods.<br>The Mann-Kendall Test for Statistical Significance is used to evaluate the trend<br>over 4 to 10 periods of measure, subject to data availability and comparability.
Economy / Housing & Homes
Economy / Housing & Homes
Census Tract: 06001436200 (Hayward Acres)
Value
Compared to:
Census Tract: 06001436200 (Hayward Acres) Homeowner Vacancy Rate
Census Tract: 06001436200 (Hayward Acres) Homeowner Vacancy Rate
0.0%
(2018-2022)
Compared to:
U.S. Census Tracts
(2014-2018)
The distribution is based on data from 71,848 U.S. census tracts.
Alameda, CA County Value
(0.8%)
The regional value is compared to the Alameda County value.
Trend
This comparison measures the indicator’s values over multiple time periods.<br>The Mann-Kendall Test for Statistical Significance is used to evaluate the trend<br>over 4 to 10 periods of measure, subject to data availability and comparability.
Census Tract: 06001436200 (Hayward Acres) Homeownership
Census Tract: 06001436200 (Hayward Acres) Homeownership
12.1%
(2018-2022)
Compared to:

Alameda County Census Tracts
The distribution is based on data from 342 Alameda County Census Tracts.
CA Census Tracts
The distribution is based on data from 9,044 California census tracts.
U.S. Census Tracts
The distribution is based on data from 82,515 U.S. census tracts.
Alameda, CA County Value
(51.0%)
The regional value is compared to the Alameda County value.
Trend
This comparison measures the indicator’s values over multiple time periods.<br>The Mann-Kendall Test for Statistical Significance is used to evaluate the trend<br>over 4 to 10 periods of measure, subject to data availability and comparability.
Census Tract: 06001436200 (Hayward Acres) Median Household Gross Rent
Census Tract: 06001436200 (Hayward Acres) Median Household Gross Rent
$2,161
(2018-2022)
Compared to:
CA Census Tracts
The distribution is based on data from 8,401 California census tracts.
Alameda County Census Tracts
The distribution is based on data from 312 Alameda County Census Tracts.
Alameda, CA County Value
($2,229)
The regional value is compared to the Alameda County value.
Trend
This comparison measures the indicator’s values over multiple time periods.<br>The Mann-Kendall Test for Statistical Significance is used to evaluate the trend<br>over 4 to 10 periods of measure, subject to data availability and comparability.
Census Tract: 06001436200 (Hayward Acres) Mortgaged Owners Median Monthly Household Costs
Census Tract: 06001436200 (Hayward Acres) Mortgaged Owners Median Monthly Household Costs
$2,886
(2018-2022)
Compared to:
Alameda County Census Tracts
The distribution is based on data from 255 Alameda County Census Tracts.
CA Census Tracts
The distribution is based on data from 7,543 California census tracts.
Alameda, CA County Value
($3,547)
The regional value is compared to the Alameda County value.
Trend
This comparison measures the indicator’s values over multiple time periods.<br>The Mann-Kendall Test for Statistical Significance is used to evaluate the trend<br>over 4 to 10 periods of measure, subject to data availability and comparability.
Census Tract: 06001436200 (Hayward Acres) Renters Spending 30% or More of Household Income on Rent
Census Tract: 06001436200 (Hayward Acres) Renters Spending 30% or More of Household Income on Rent
55.0%
(2018-2022)
Compared to:
Alameda County Census Tracts
The distribution is based on data from 342 Alameda County Census Tracts.
CA Census Tracts
The distribution is based on data from 9,025 California census tracts.
U.S. Census Tracts
The distribution is based on data from 82,039 U.S. census tracts.
Alameda, CA County Value
(48.9%)
The regional value is compared to the Alameda County value.
Trend
This comparison measures the indicator’s values over multiple time periods.<br>The Mann-Kendall Test for Statistical Significance is used to evaluate the trend<br>over 4 to 10 periods of measure, subject to data availability and comparability.
HP 2030 Target
(25.5%)
Economy / Income
Economy / Income
Census Tract: 06001436200 (Hayward Acres)
Value
Compared to:
Census Tract: 06001436200 (Hayward Acres) Income Inequality
Census Tract: 06001436200 (Hayward Acres) Income Inequality
0.385
(2018-2022)
Compared to:
Alameda County Census Tracts
The distribution is based on data from 342 Alameda County Census Tracts.
CA Census Tracts
The distribution is based on data from 9,037 California census tracts.
U.S. Census Tracts
The distribution is based on data from 82,409 U.S. census tracts.
Alameda, CA County Value
(0.469)
The regional value is compared to the Alameda County value.
Trend
This comparison measures the indicator’s values over multiple time periods.<br>The Mann-Kendall Test for Statistical Significance is used to evaluate the trend<br>over 4 to 10 periods of measure, subject to data availability and comparability.
Census Tract: 06001436200 (Hayward Acres) Median Household Income
Census Tract: 06001436200 (Hayward Acres) Median Household Income
$72,740
(2018-2022)
Compared to:
Alameda County Census Tracts
The distribution is based on data from 333 Alameda County Census Tracts.
CA Census Tracts
The distribution is based on data from 8,875 California census tracts.
U.S. Census Tracts
The distribution is based on data from 81,653 U.S. census tracts.
Alameda, CA County Value
($122,488)
The regional value is compared to the Alameda County value.
Trend
This comparison measures the indicator’s values over multiple time periods.<br>The Mann-Kendall Test for Statistical Significance is used to evaluate the trend<br>over 4 to 10 periods of measure, subject to data availability and comparability.
Census Tract: 06001436200 (Hayward Acres) Per Capita Income
Census Tract: 06001436200 (Hayward Acres) Per Capita Income
$30,001
(2018-2022)
Compared to:
CA Census Tracts
The distribution is based on data from 9,076 California census tracts.
Alameda County Census Tracts
The distribution is based on data from 342 Alameda County Census Tracts.
U.S. Census Tracts
The distribution is based on data from 82,680 U.S. census tracts.
Alameda, CA County Value
($60,193)
The regional value is compared to the Alameda County value.
Trend
This comparison measures the indicator’s values over multiple time periods.<br>The Mann-Kendall Test for Statistical Significance is used to evaluate the trend<br>over 4 to 10 periods of measure, subject to data availability and comparability.
Economy / Poverty
Economy / Poverty
Census Tract: 06001436200 (Hayward Acres)
Value
Compared to:
Census Tract: 06001436200 (Hayward Acres) Children Living Below Poverty Level
Census Tract: 06001436200 (Hayward Acres) Children Living Below Poverty Level
15.2%
(2018-2022)
Compared to:
Alameda County Census Tracts
The distribution is based on data from 339 Alameda County Census Tracts.
CA Census Tracts
The distribution is based on data from 9,000 California census tracts.
U.S. Census Tracts
The distribution is based on data from 82,083 U.S. census tracts.
Alameda, CA County Value
(9.4%)
The regional value is compared to the Alameda County value.
Trend
This comparison measures the indicator’s values over multiple time periods.<br>The Mann-Kendall Test for Statistical Significance is used to evaluate the trend<br>over 4 to 10 periods of measure, subject to data availability and comparability.
Census Tract: 06001436200 (Hayward Acres) Families Living Below Poverty Level
Census Tract: 06001436200 (Hayward Acres) Families Living Below Poverty Level
6.6%
(2018-2022)
Compared to:
Alameda County Census Tracts
The distribution is based on data from 342 Alameda County Census Tracts.
CA Census Tracts
The distribution is based on data from 9,039 California census tracts.
U.S. Census Tracts
The distribution is based on data from 82,428 U.S. census tracts.
Alameda, CA County Value
(5.5%)
The regional value is compared to the Alameda County value.
Trend
This comparison measures the indicator’s values over multiple time periods.<br>The Mann-Kendall Test for Statistical Significance is used to evaluate the trend<br>over 4 to 10 periods of measure, subject to data availability and comparability.
Census Tract: 06001436200 (Hayward Acres) People 65+ Living Below Poverty Level
Census Tract: 06001436200 (Hayward Acres) People 65+ Living Below Poverty Level
13.7%
(2018-2022)
Compared to:
Alameda County Census Tracts
The distribution is based on data from 341 Alameda County Census Tracts.
CA Census Tracts
The distribution is based on data from 9,016 California census tracts.
U.S. Census Tracts
The distribution is based on data from 82,202 U.S. census tracts.
Alameda, CA County Value
(10.4%)
The regional value is compared to the Alameda County value.
Trend
This comparison measures the indicator’s values over multiple time periods.<br>The Mann-Kendall Test for Statistical Significance is used to evaluate the trend<br>over 4 to 10 periods of measure, subject to data availability and comparability.
Census Tract: 06001436200 (Hayward Acres) People 65+ Living Below Poverty Level (Count)
Census Tract: 06001436200 (Hayward Acres) People 65+ Living Below Poverty Level (Count)
67
People
(2018-2022)
Compared to:
Trend
This comparison measures the indicator’s values over multiple time periods.<br>The Mann-Kendall Test for Statistical Significance is used to evaluate the trend<br>over 4 to 10 periods of measure, subject to data availability and comparability.
Census Tract: 06001436200 (Hayward Acres) People Living 200% Above Poverty Level
Census Tract: 06001436200 (Hayward Acres) People Living 200% Above Poverty Level
70.5%
(2018-2022)
Compared to:
Alameda County Census Tracts
The distribution is based on data from 342 Alameda County Census Tracts.
CA Census Tracts
The distribution is based on data from 9,049 California census tracts.
U.S. Census Tracts
The distribution is based on data from 82,546 U.S. census tracts.
Alameda, CA County Value
(80.6%)
The regional value is compared to the Alameda County value.
Trend
This comparison measures the indicator’s values over multiple time periods.<br>The Mann-Kendall Test for Statistical Significance is used to evaluate the trend<br>over 4 to 10 periods of measure, subject to data availability and comparability.
Census Tract: 06001436200 (Hayward Acres) People Living Below Poverty Level
Census Tract: 06001436200 (Hayward Acres) People Living Below Poverty Level
10.9%
(2018-2022)
Compared to:
Alameda County Census Tracts
The distribution is based on data from 342 Alameda County Census Tracts.
CA Census Tracts
The distribution is based on data from 9,049 California census tracts.
U.S. Census Tracts
The distribution is based on data from 82,546 U.S. census tracts.
Alameda, CA County Value
(9.2%)
The regional value is compared to the Alameda County value.
Trend
This comparison measures the indicator’s values over multiple time periods.<br>The Mann-Kendall Test for Statistical Significance is used to evaluate the trend<br>over 4 to 10 periods of measure, subject to data availability and comparability.
HP 2030 Target
(8.0%)
Census Tract: 06001436200 (Hayward Acres) Youth not in School or Working
Census Tract: 06001436200 (Hayward Acres) Youth not in School or Working
0.0%
(2018-2022)
Compared to:
U.S. Census Tracts
(2016-2020)
The distribution is based on data from 82,304 U.S. census tracts.
Alameda, CA County Value
(0.6%)
The regional value is compared to the Alameda County value.
Trend
This comparison measures the indicator’s values over multiple time periods.<br>The Mann-Kendall Test for Statistical Significance is used to evaluate the trend<br>over 4 to 10 periods of measure, subject to data availability and comparability.
Education / Educational Attainment
Education / Educational Attainment
Census Tract: 06001436200 (Hayward Acres)
Value
Compared to:
Census Tract: 06001436200 (Hayward Acres) People 25+ with a Bachelor's Degree or Higher
Census Tract: 06001436200 (Hayward Acres) People 25+ with a Bachelor's Degree or Higher
22.6%
(2018-2022)
Compared to:
CA Census Tracts
The distribution is based on data from 9,076 California census tracts.
Alameda County Census Tracts
The distribution is based on data from 342 Alameda County Census Tracts.
U.S. Census Tracts
The distribution is based on data from 82,720 U.S. census tracts.
Alameda, CA County Value
(50.9%)
The regional value is compared to the Alameda County value.
Trend
This comparison measures the indicator’s values over multiple time periods.<br>The Mann-Kendall Test for Statistical Significance is used to evaluate the trend<br>over 4 to 10 periods of measure, subject to data availability and comparability.
Census Tract: 06001436200 (Hayward Acres) People 25+ with a High School Diploma or Higher
Census Tract: 06001436200 (Hayward Acres) People 25+ with a High School Diploma or Higher
79.8%
(2018-2022)
Compared to:
CA Census Tracts
The distribution is based on data from 9,076 California census tracts.
Alameda County Census Tracts
The distribution is based on data from 342 Alameda County Census Tracts.
U.S. Census Tracts
The distribution is based on data from 82,720 U.S. census tracts.
Alameda, CA County Value
(89.2%)
The regional value is compared to the Alameda County value.
Trend
This comparison measures the indicator’s values over multiple time periods.<br>The Mann-Kendall Test for Statistical Significance is used to evaluate the trend<br>over 4 to 10 periods of measure, subject to data availability and comparability.
